Full Report
The numbers behind NerdWallet, Inc.: as-reported financial statements and company metrics for FY2021–FY2025, traced to the source filings, opened with the share-price history those statements have to justify. Every linked figure opens the exact page of the filing it was printed on, with the statement row highlighted. Amounts in US$ millions unless noted.
Reading notes: All figures are in US$ millions exactly as printed by NerdWallet - every Form 10-K and Form 10-Q in the corpus states '(in millions, except per share amounts)'. Each fiscal year in the five-year statement columns is cited to that year's own Form 10-K: FY2021 to the FY2021 10-K, FY2022 to the FY2022 10-K, and so on. Every cell in the income statement, balance sheet and cash flow statement for FY2021-FY2025 is page-verified. Revenue by product category uses NerdWallet's current cut (Insurance, Credit cards, SMB products, Loans, Emerging verticals). Insurance was first broken out in the FY2024 Form 10-K, which restates 2023 and 2022 on the same basis - so FY2022-FY2024 are cited to that filing. FY2021 predates the carve-out and is cited to the FY2023 Form 10-K, where Emerging verticals of 89.6 still includes insurance and no Insurance line exists. The FY2025 Form 10-K no longer prints the 'Change in fair value of contingent consideration related to earnouts' expense line (the earnouts ran off in 2022), so that row is blank for FY2025 rather than zero.
Share Price — Full Available History — 5 Years
The stock closed at $8.88 on Jul 24, 2026 — down 69% over the window shown (-21.8% a year), trading between $6.51 and $28.30. At that close the stock trades at 14× FY2025 diluted EPS as reported below.
Source: market price feed, weekly closes, sampled from 1,182 source observations, Nov 2021–Jul 2026. Price return only, excludes dividends.
Market capitalization $482mn.
Market cap = 54.3M shares outstanding × the Jul 24, 2026 close of $8.88. Market-derived, shown without filing links.
FY2025 at a Glance
Revenue (US$ millions)
Net income (US$ millions)
Diluted EPS
Source: FY2025 consolidated statements [1] [2] [3] [4]. Click any linked figure to open the filing page with the row highlighted.
Revenue by Product Category
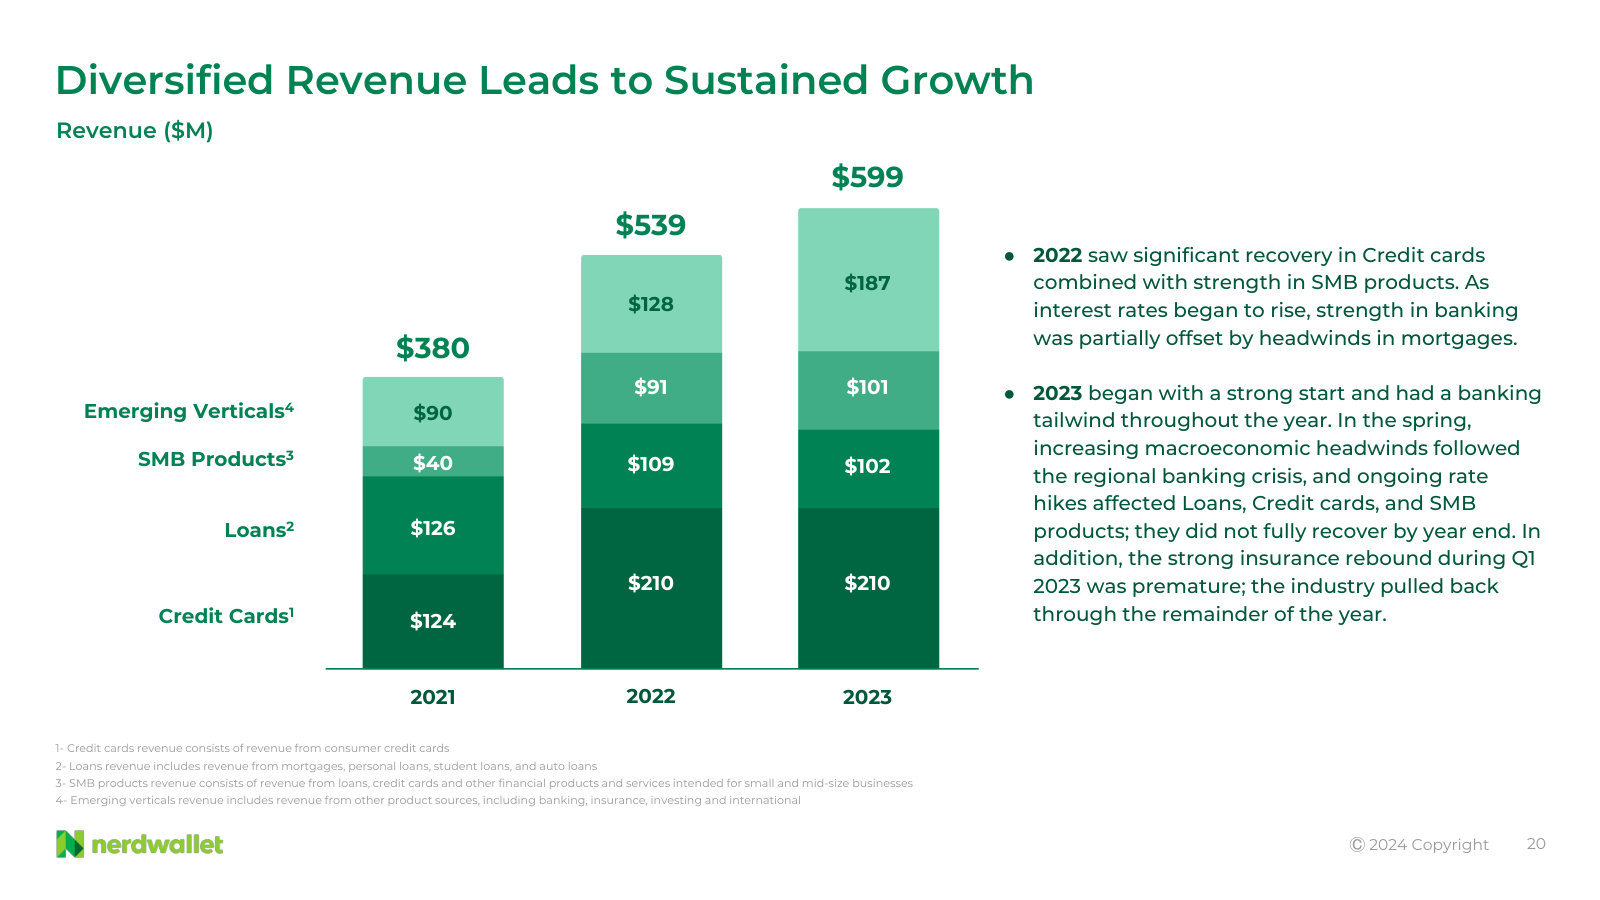
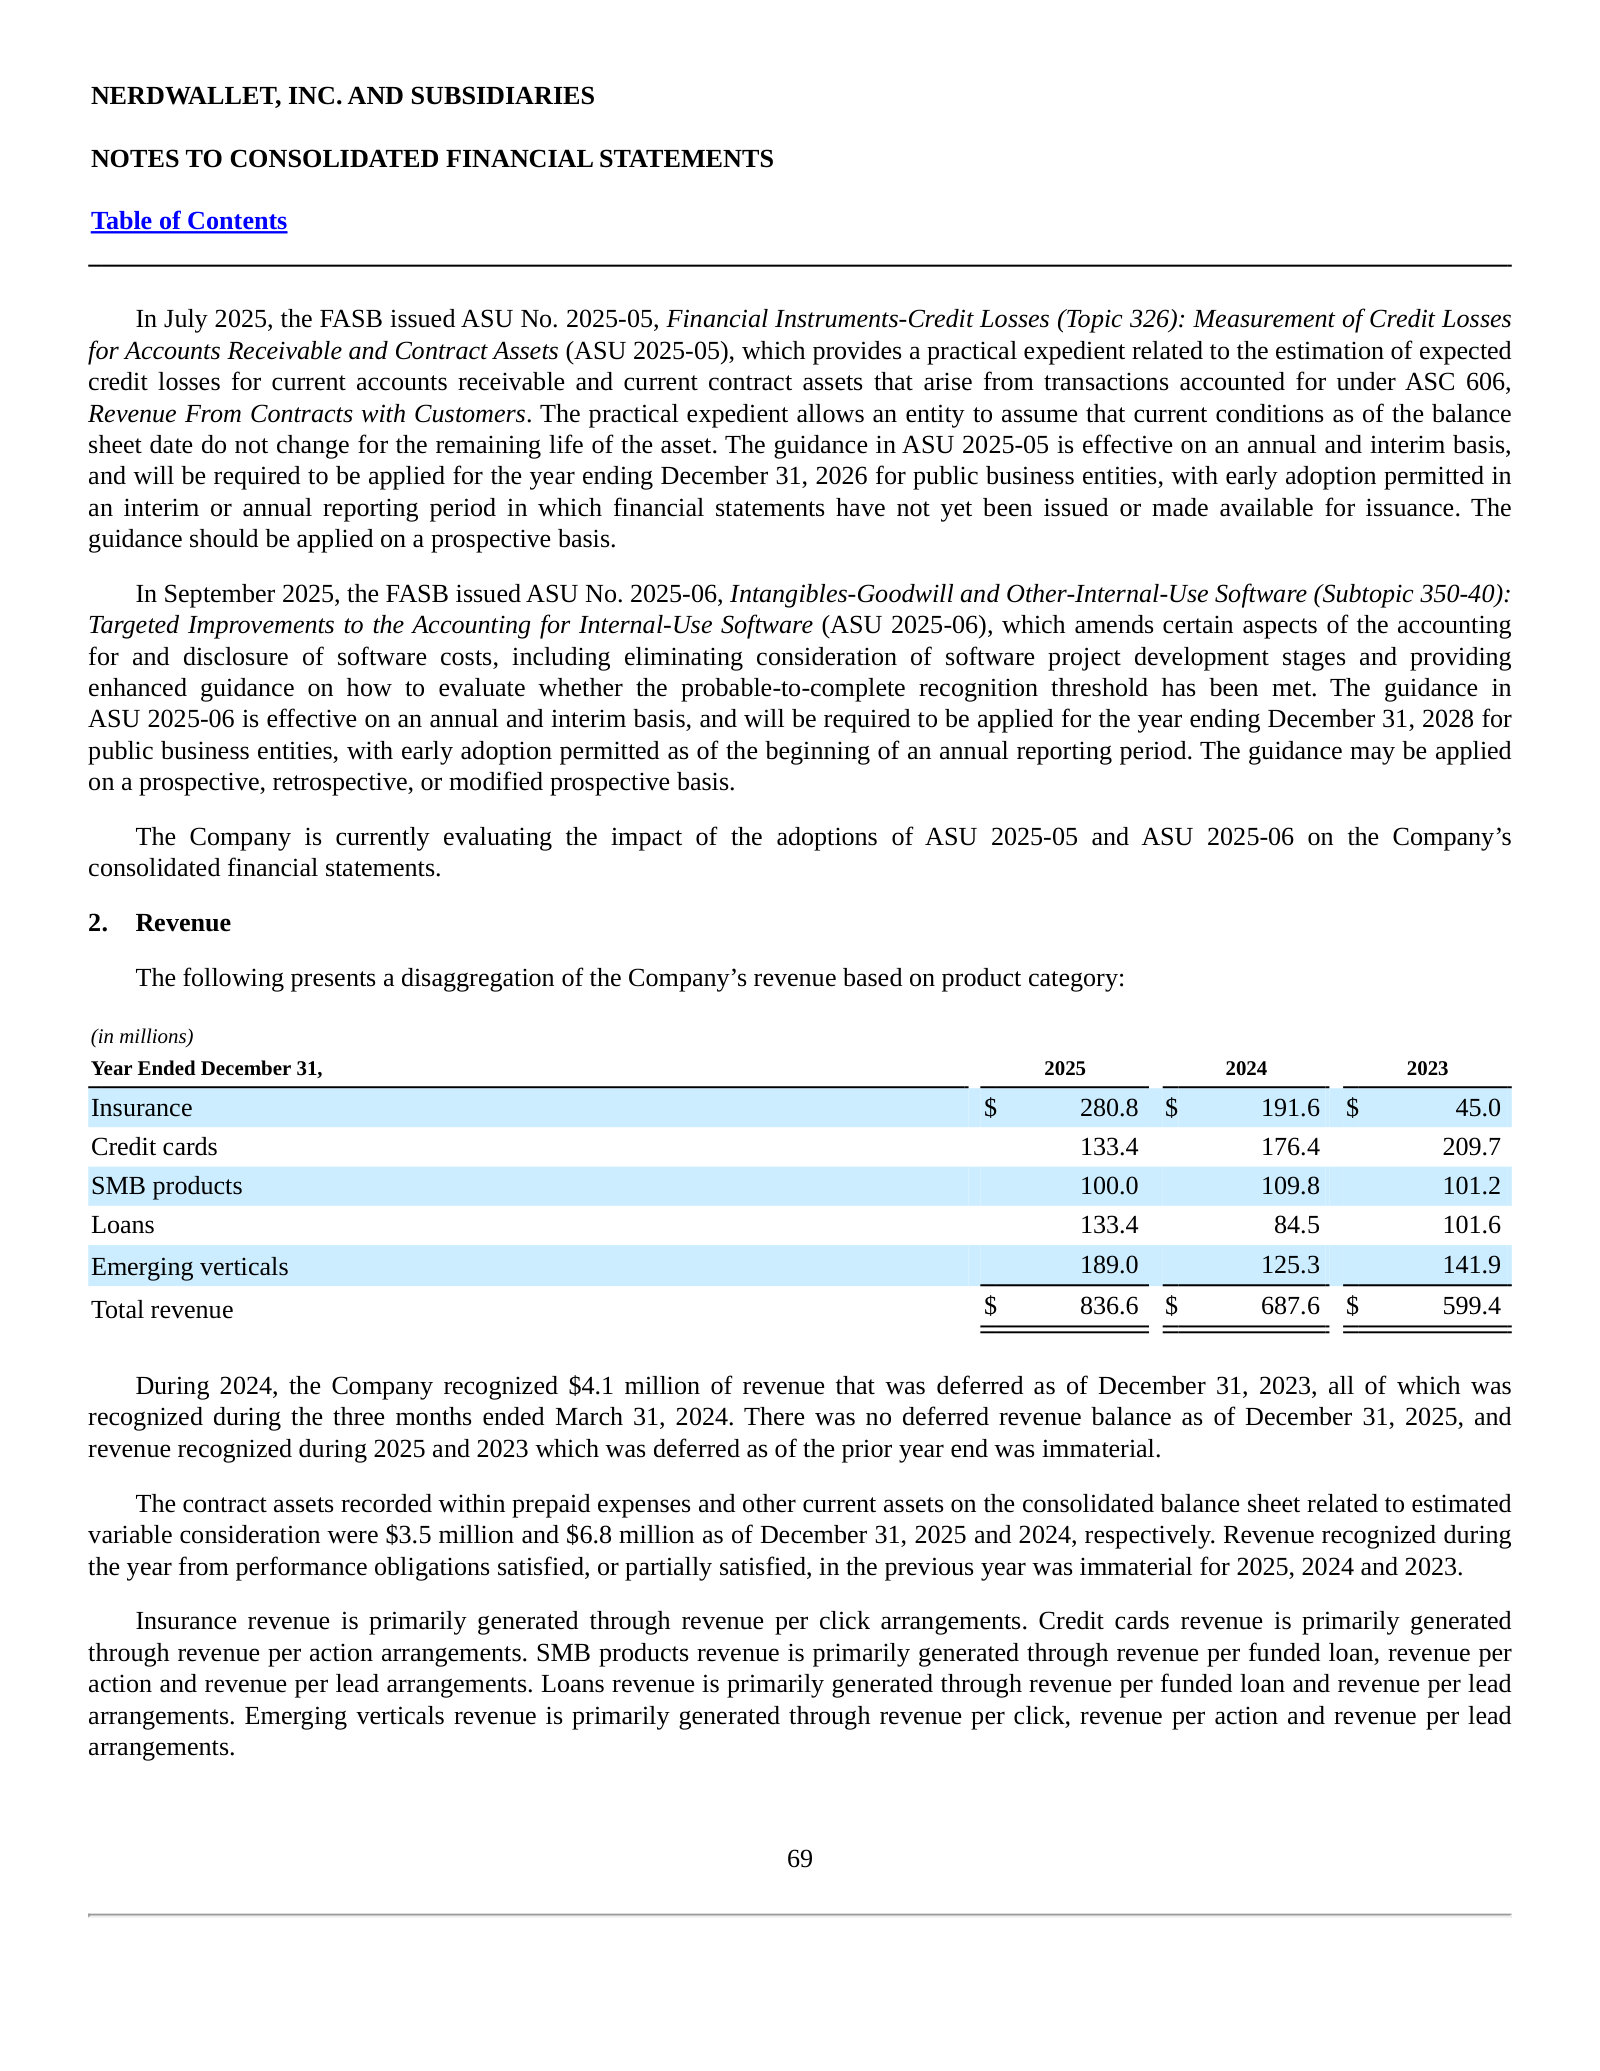
| Revenue by Product Category | FY2021 | FY2022 | FY2023 | FY2024 | FY2025 |
|---|---|---|---|---|---|
| Insurance | — | 34 | 45 | 192 | 281 |
| Credit cards | 124 | 210 | 210 | 176 | 133 |
| SMB products | 40 | 91 | 101 | 110 | 100 |
| Loans | 126 | 109 | 102 | 84 | 133 |
| Emerging verticals | 90 | 94 | 142 | 125 | 189 |
| Total revenue | 380 | 539 | 599 | 688 | 837 |
| Total revenue growth, derived | — | +42.0% | +11.2% | +14.7% | +21.7% |
Source: Note 2 - Revenue: disaggregation of revenue based on product category (Form 10-K). NerdWallet has a single reportable segment; product category is the company's own reported revenue cut. [5] [6] [7]. Click any linked figure to open the filing page with the row highlighted.
Income Statement
Source: Consolidated Statements of Operations, Form 10-K (each year cited to its own annual report) [1] [2] [3] [4]. Click any linked figure to open the filing page with the row highlighted.
Columns marked E are consensus analyst estimates from S&P Capital IQ (CapIQ), shown alongside reported results for direct comparison; they are not company guidance.
Estimate source: S&P Capital IQ (CapIQ) consensus, as of 2026-07-27. Estimate figures are S&P Capital IQ consensus (vendor data — no filing page links). EPS and net income use the normalized (adjusted) consensus where the street reports it. Line-item analyst models (segments, drivers, KPIs) are in the Visible Alpha tab.
Balance Sheet
Source: Consolidated Balance Sheets, Form 10-K (each year cited to its own annual report) [8] [9] [10] [11]. Click any linked figure to open the filing page with the row highlighted.
Cash Flow
Source: Consolidated Statements of Cash Flows, Form 10-K (each year cited to its own annual report) [12] [13] [14] [15]. Click any linked figure to open the filing page with the row highlighted.
Marketing Engine
| Marketing Engine | FY2021 | FY2022 | FY2023 | FY2024 | FY2025 |
|---|---|---|---|---|---|
| Performance marketing expense | — | 168 | 206 | 297 | 417 |
| Brand marketing expense | — | 106 | 84 | 69 | 65 |
| Organic and other marketing expense | — | 101 | 111 | 105 | 103 |
| Performance marketing - % of sales and marketing | 36.0% | 45.0% | 51.0% | 63.0% | 71.0% |
| Brand marketing - % of sales and marketing | 35.0% | 28.0% | 21.0% | 15.0% | 11.0% |
| Advertising expense | 197 | 279 | 295 | 370 | 486 |
Source: company filings [16] [17] [18] [19]. Click any linked figure to open the filing page with the row highlighted.
Non-GAAP Scorecard
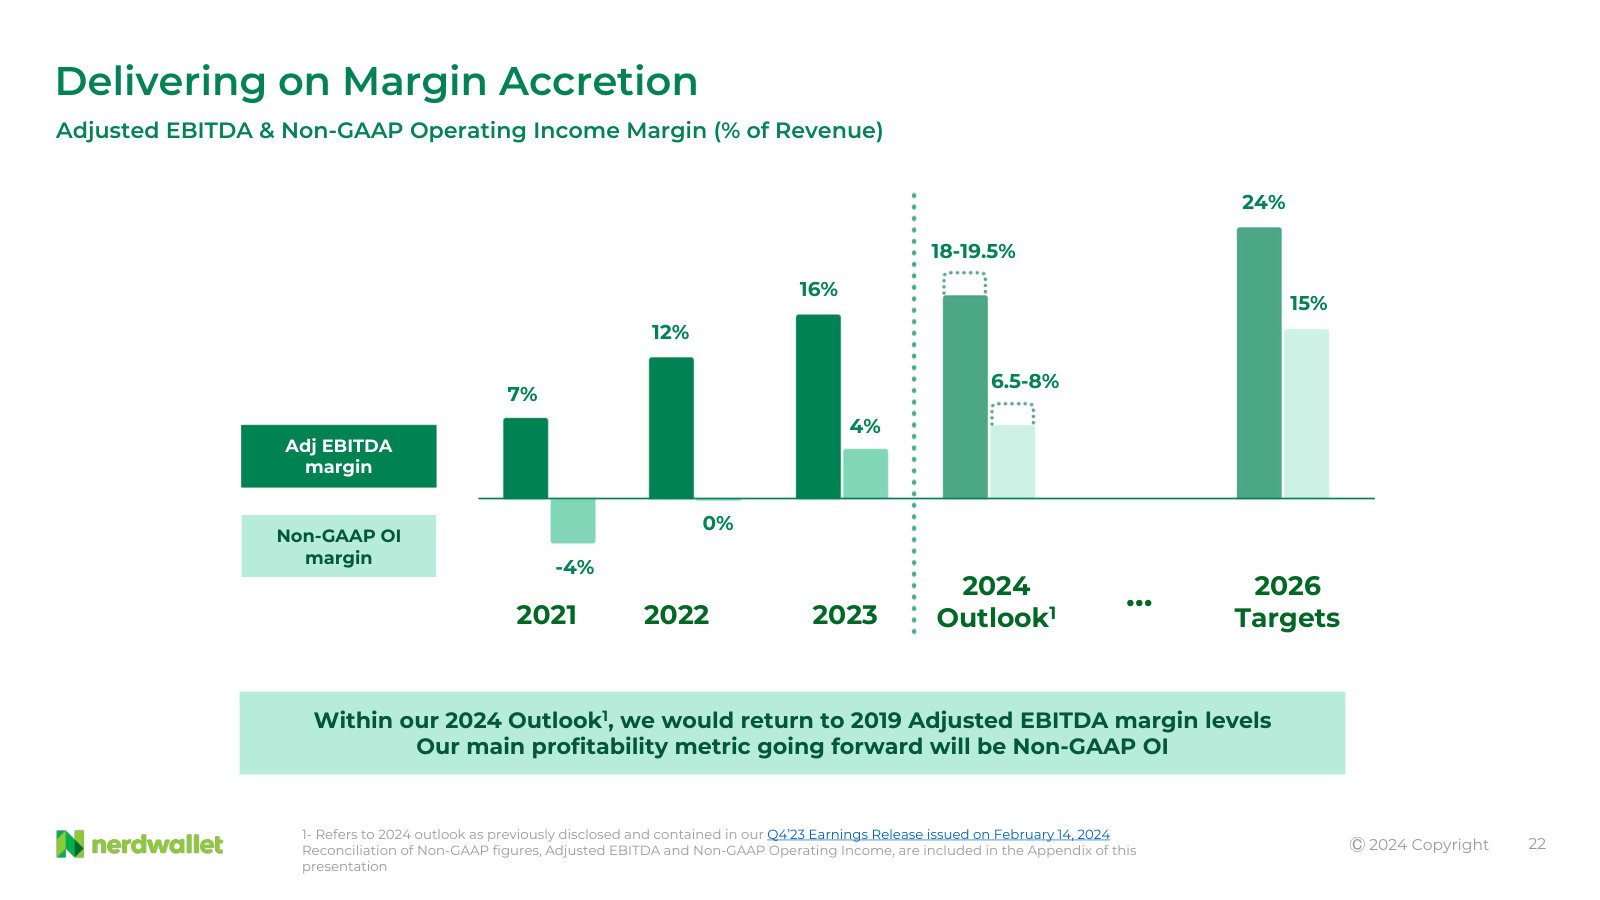
| Non-GAAP Scorecard | FY2021 | FY2022 | FY2023 | FY2024 | FY2025 |
|---|---|---|---|---|---|
| Adjusted EBITDA | 27 | 67 | 98 | 108 | 145 |
| Adjusted EBITDA margin | 7.0% | 12.0% | 16.0% | 16.0% | 17.0% |
| Non-GAAP operating income (loss) | (15) | (1) | 26 | 48 | 96 |
| Non-GAAP operating income (loss) margin | (4.0%) | 0.0% | 4.0% | 7.0% | 11.0% |
| Operating income (loss) margin | (10.0%) | (4.0%) | 1.0% | 1.0% | 8.0% |
Source: company filings [20] [21] [22] [23]. Click any linked figure to open the filing page with the row highlighted.
Cost Structure (% of revenue, as reported)
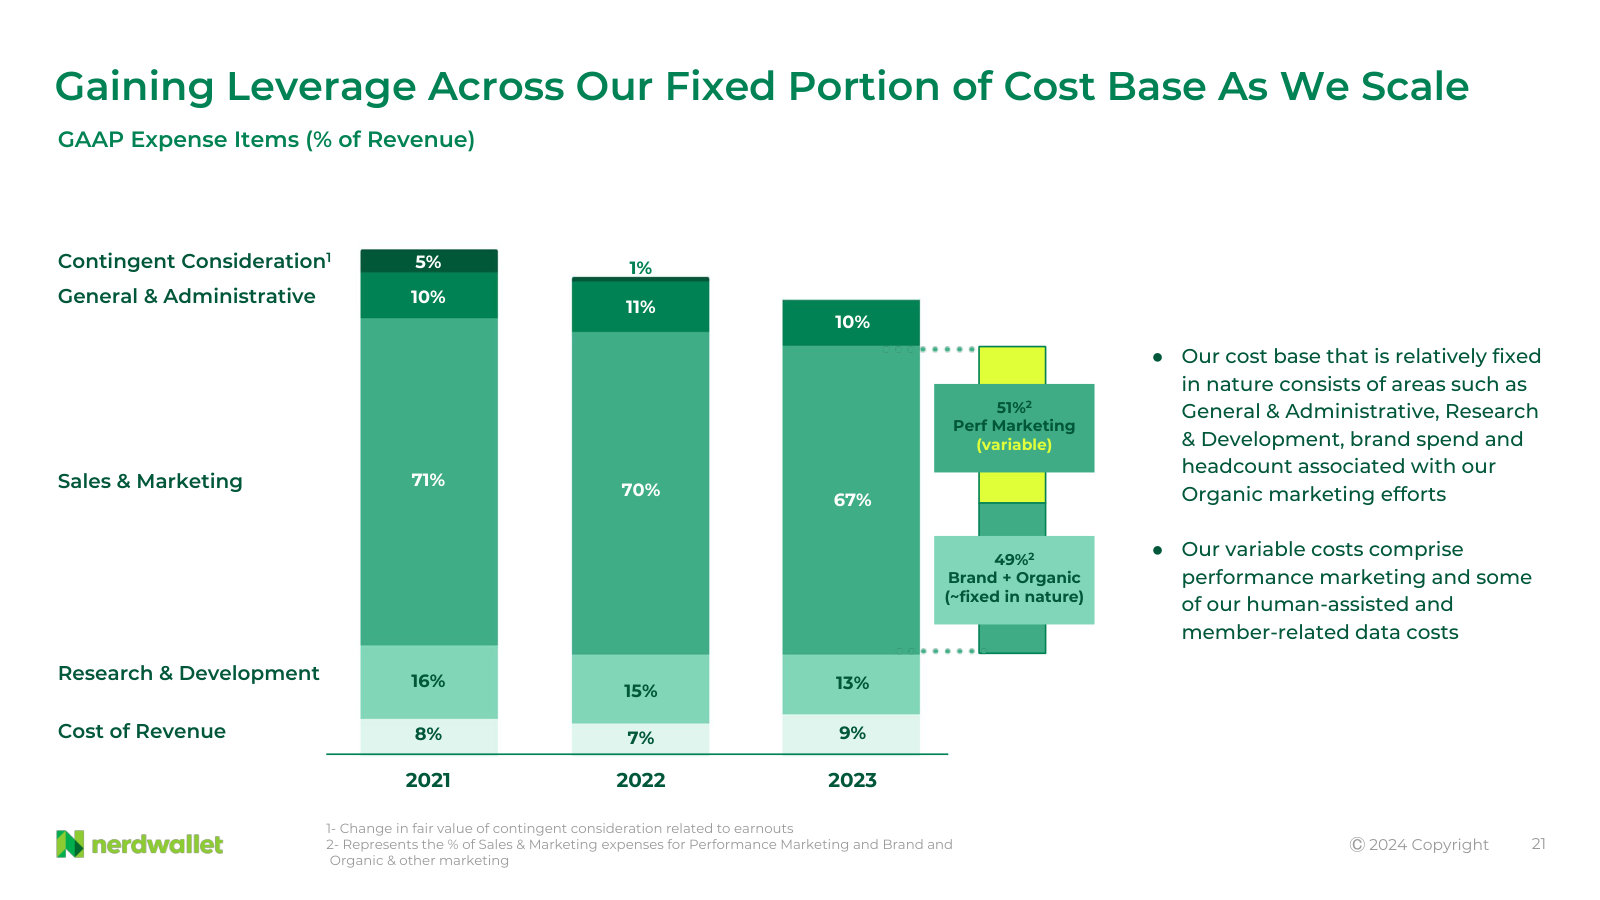
| Cost Structure (% of revenue, as reported) | FY2021 | FY2022 | FY2023 | FY2024 | FY2025 |
|---|---|---|---|---|---|
| Cost of revenue | 8.0% | 7.0% | 9.0% | 9.0% | 7.0% |
| Research and development | 16.0% | 15.0% | 13.0% | 12.0% | 8.0% |
| Sales and marketing | 71.0% | 70.0% | 67.0% | 69.0% | 70.0% |
| General and administrative | 10.0% | 11.0% | 10.0% | 9.0% | 7.0% |
| Total costs and expenses | 110.0% | 104.0% | 99.0% | 99.0% | 92.0% |
Source: company filings [24] [25]. Click any linked figure to open the filing page with the row highlighted.
Partner Concentration
| Partner Concentration | FY2021 | FY2022 | FY2023 | FY2024 | FY2025 |
|---|---|---|---|---|---|
| Largest customer - % of revenue | — | 12.0% | 13.0% | 22.0% | 26.0% |
| Second-largest customer - % of revenue | — | — | 11.0% | 11.0% | — |
| Largest customer - % of accounts receivable | 11.0% | 15.0% | 14.0% | 14.0% | 16.0% |
| Money market funds held | — | 75 | 90 | 37 | 67 |
Source: company filings [26] [27] [28] [29]. Click any linked figure to open the filing page with the row highlighted.
Capital Returns, Credit Capacity and Headcount
| Capital Returns, Credit Capacity and Headcount | FY2021 | FY2022 | FY2023 | FY2024 | FY2025 |
|---|---|---|---|---|---|
| Class A shares repurchased during the year | — | — | 2,300,000 | 6,500,000 | 5,800,000 |
| Senior secured revolving credit facility - commitment | — | — | 125 | 125 | 125 |
| Outstanding balance on credit facility | — | — | 0 | 0 | 0 |
| Warehouse line of credit outstanding (NerdWallet Direct Lending) | — | — | — | 2 | 7 |
| Full-time employees at year end | 675 | 770 | 730 | 650 | 650 |
Source: company filings [30] [31] [32] [33]. Click any linked figure to open the filing page with the row highlighted.
Long-Term Record
| Fiscal year | Total revenue | Income (Loss) From Operations | Net Income (Loss) | Net Income (Loss) per Share - Diluted | Net cash provided by operating activities | Total stockholders' equity |
|---|---|---|---|---|---|---|
| FY2019 | 228 | 28 | 24 | 0.45 | 31 | 8 |
| FY2020 | 245 | 2 | 5 | 0.09 | 15 | 83 |
| FY2021 | 380 | (39) | (42) | (0.82) | 7 | 258 |
| FY2022 | 539 | (19) | (10) | (0.14) | 25 | 342 |
| FY2023 | 599 | 4 | (12) | (0.15) | 72 | 367 |
| FY2024 | 688 | 9 | 30 | 0.38 | 72 | 364 |
| FY2025 | 837 | 65 | 49 | 0.64 | 132 | 374 |
Source: consolidated statements across filings; older years from the standardized feed [12] [1] [8] [13]. Click any linked figure to open the filing page with the row highlighted.
Operating KPIs
| KPI | FY2021 | FY2022 | FY2023 | FY2024 | FY2025 |
|---|---|---|---|---|---|
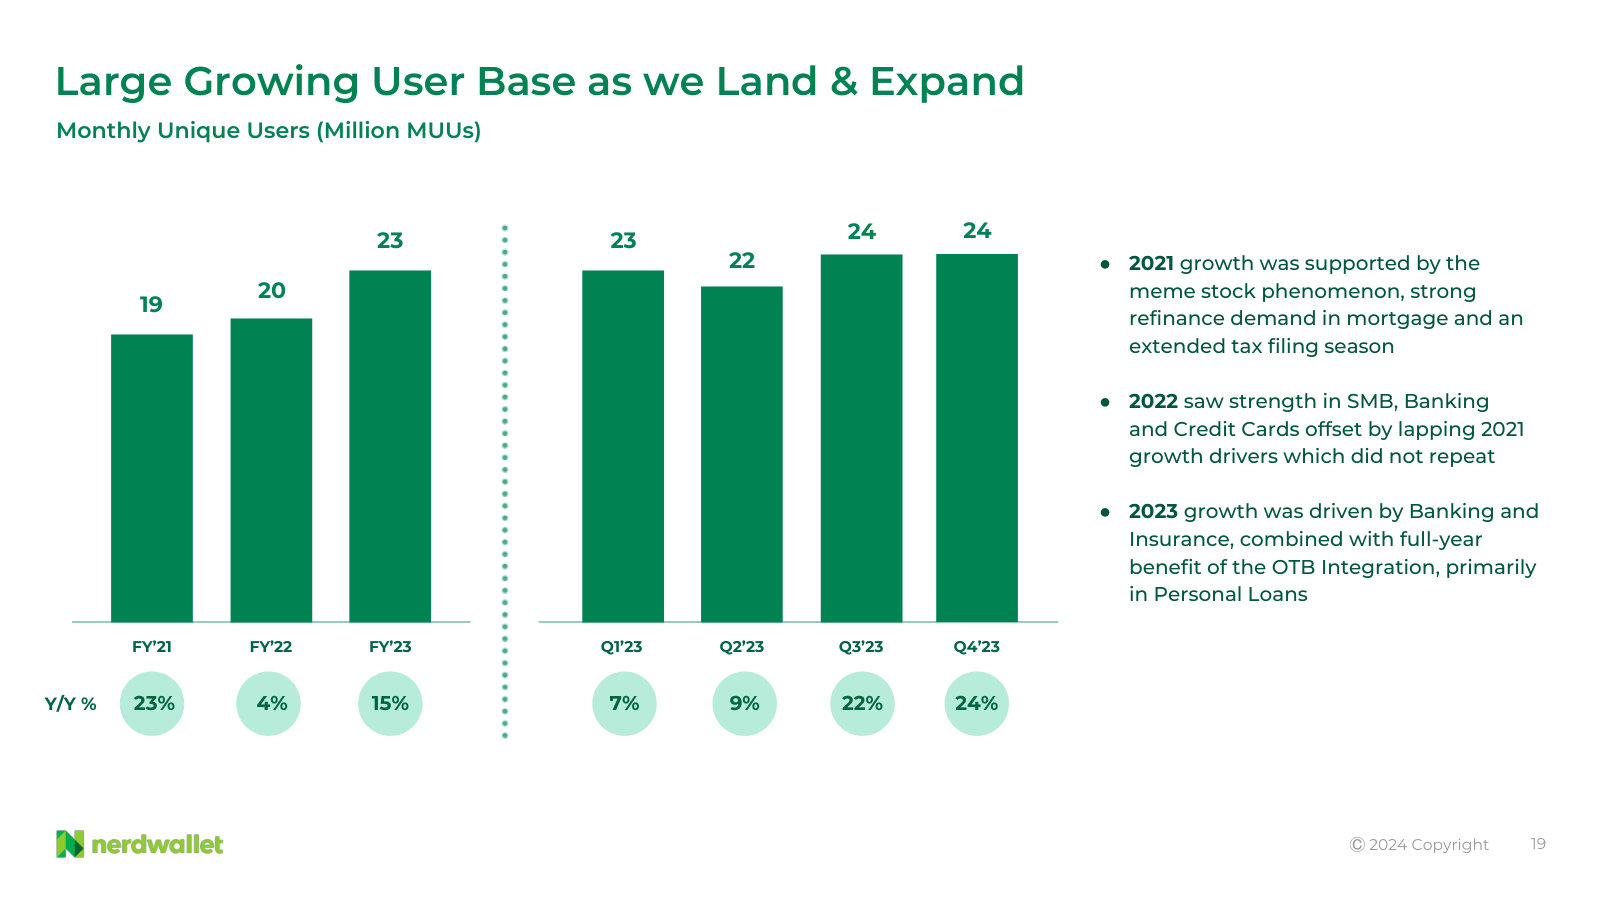
| Monthly Unique Users (MUUs), average for the year | 19,000,000 | 20,000,000 | 23,000,000 | — | — |
| Registered users at year end | 10,000,000 | 14,000,000 | 19,000,000 | 25,000,000 | — |
Source: company-reported operating metrics [34] [35] [36] [37]. Click any linked figure to open the filing page with the row highlighted.
Analyst Consensus
Mean target
Median target
High target
Low target
Street ratings: 4 strong buy, 1 hold, 1 strong sell. Consensus: Buy.
Estimate source: S&P Capital IQ (CapIQ) consensus, as of 2026-07-27. Estimate figures are S&P Capital IQ consensus (vendor data — no filing page links). EPS and net income use the normalized (adjusted) consensus where the street reports it. Line-item analyst models (segments, drivers, KPIs) are in the Visible Alpha tab.
Traceability
521 of 522 figures on this page (100%) link to the filing page where they are printed — click a linked figure to open the source PDF at that page with the row highlighted. Unlinked figures come from standardized data feeds or pre-filing years.
All figures are in US$ millions exactly as printed by NerdWallet - every Form 10-K and Form 10-Q in the corpus states '(in millions, except per share amounts)'.
Each fiscal year in the five-year statement columns is cited to that year's own Form 10-K: FY2021 to the FY2021 10-K, FY2022 to the FY2022 10-K, and so on. Every cell in the income statement, balance sheet and cash flow statement for FY2021-FY2025 is page-verified.
Revenue by product category uses NerdWallet's current cut (Insurance, Credit cards, SMB products, Loans, Emerging verticals). Insurance was first broken out in the FY2024 Form 10-K, which restates 2023 and 2022 on the same basis - so FY2022-FY2024 are cited to that filing. FY2021 predates the carve-out and is cited to the FY2023 Form 10-K, where Emerging verticals of 89.6 still includes insurance and no Insurance line exists.
The FY2025 Form 10-K no longer prints the 'Change in fair value of contingent consideration related to earnouts' expense line (the earnouts ran off in 2022), so that row is blank for FY2025 rather than zero.
FY2019 and FY2020 in the long-term record are comparative columns of the FY2021 Form 10-K (the company's first 10-K, filed after the November 2021 IPO) and are page-linked; FY2019 total stockholders' equity is the only long-term cell taken from the standardized data feed and is shown unlinked, because no balance sheet in the corpus prints December 31, 2019.
Monthly Unique Users and registered users are the operating metrics NerdWallet headlined in Item 1 of its Form 10-K. MUUs were last disclosed for 2023 and registered users for 2024; the FY2025 Form 10-K discloses neither, so those cells are blank. Both are as-disclosed round figures (the filings say 'over 10 million', 'over 19 million').
Quarterly income-statement and balance-sheet figures are printed columns of the Form 10-Qs, except the two Q4 columns and the Q4 balance sheets, which come from the Form 10-K. NerdWallet files no fourth-quarter 10-Q and the Q4 earnings 8-Ks in this corpus incorporate the press release by reference without reproducing the statements, so Q4 income-statement and cash-flow cells are derived as full-year less nine-month year-to-date; each reconciles exactly in display units and each derived cell is marked.
Derived single-quarter cash flows were cross-checked against data/financials/cash_flow_quarterly.json and agree exactly for every quarter the feed carries (Q2 FY24, Q3 FY24, Q1 FY25, Q2 FY25, Q3 FY25, Q1 FY26); the feed carries no Q4 rows. The derived quarterly net change in cash also reconciles to the period-end cash balances on the quarterly balance sheets.
The data feed's 'capex' field (0.6 in FY2024, 1.3 in FY2025) is purchases of property and equipment only. NerdWallet's real investment in its platform runs through 'Capitalized software development costs' (20.7 in FY2024, 16.9 in FY2025), which is a separate investing line in the printed statements and is shown as its own row here.
NerdWallet has no funded debt: the balance sheets show no borrowings other than a warehouse line of credit used by its mortgage subsidiary, so no debt rows are shown.
3 figure(s) differed between the data feed and the filing; the filing value is shown (see the run's metrics/metrics_tab.json for the audit trail).
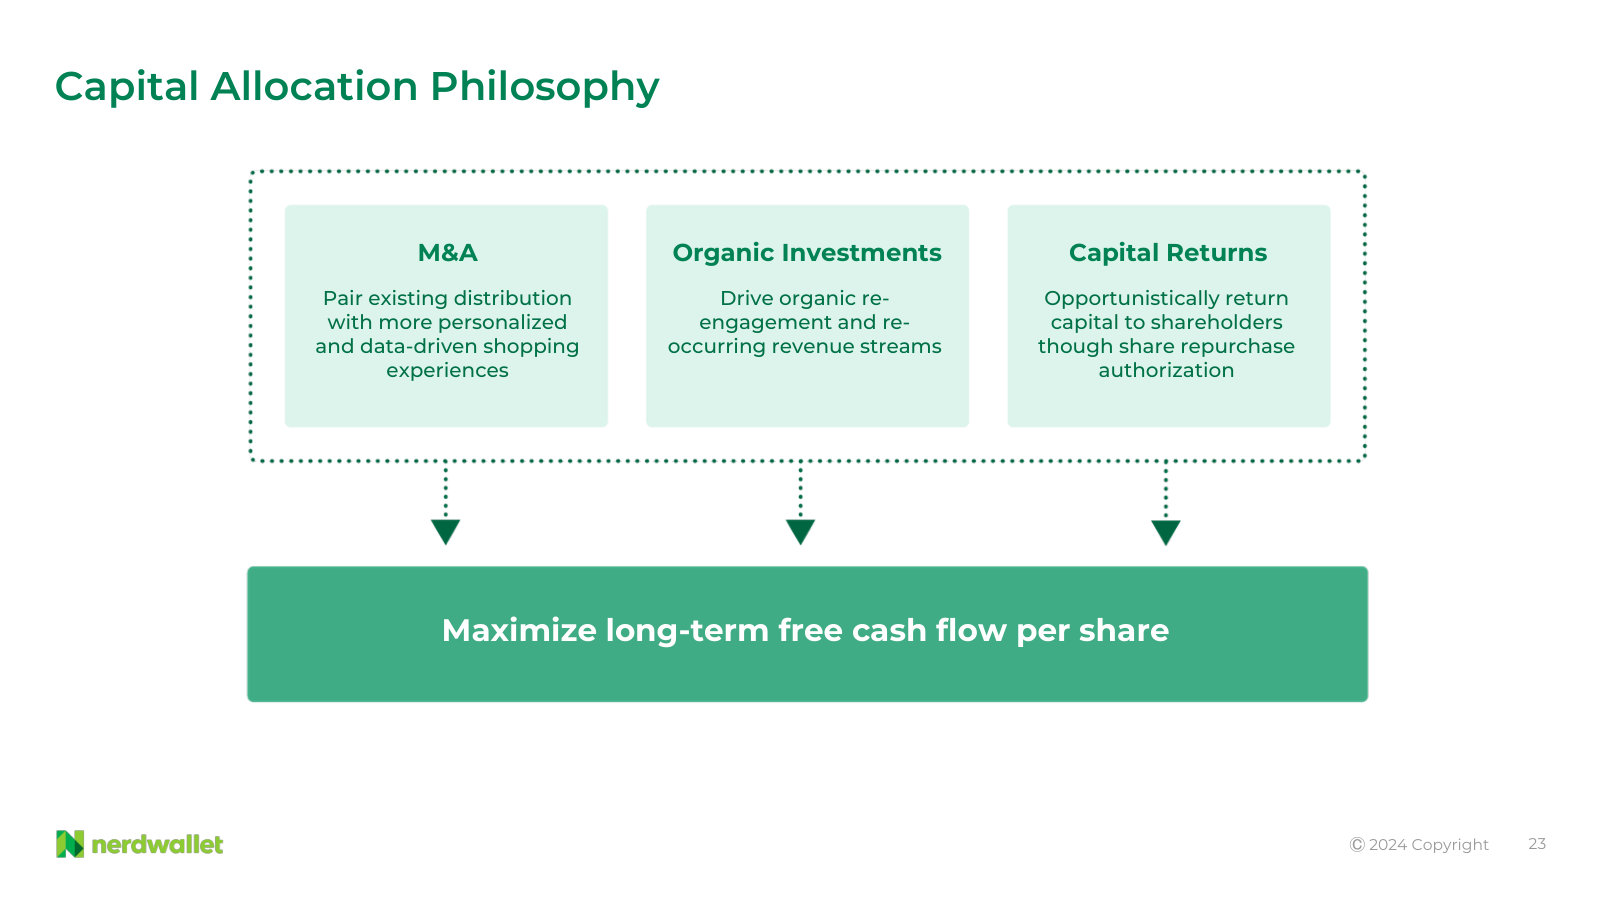
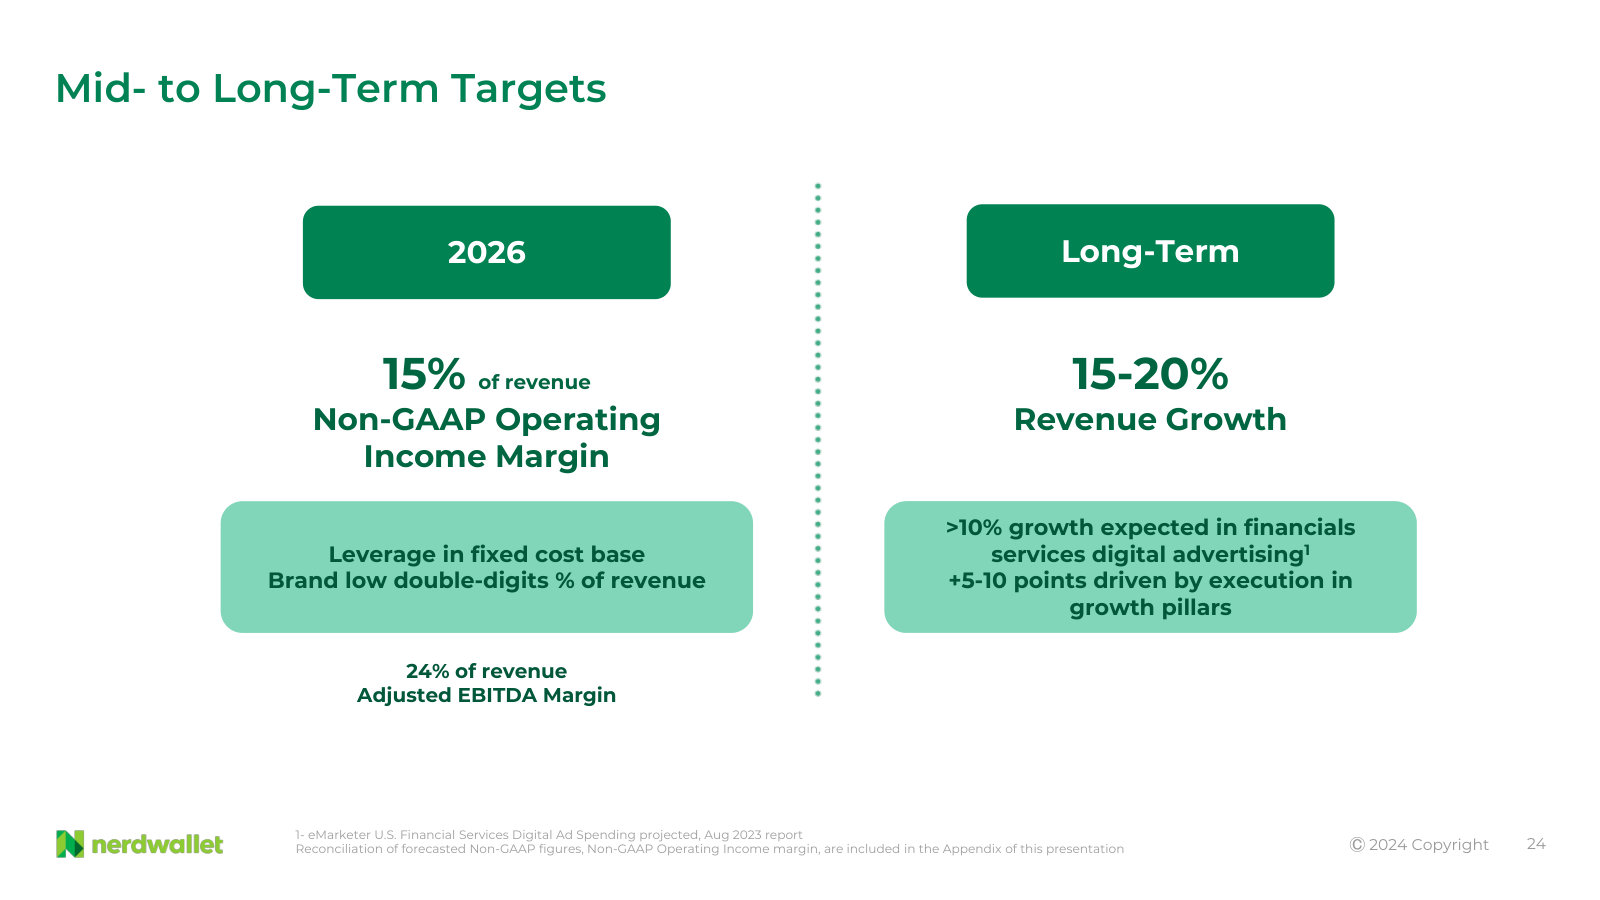
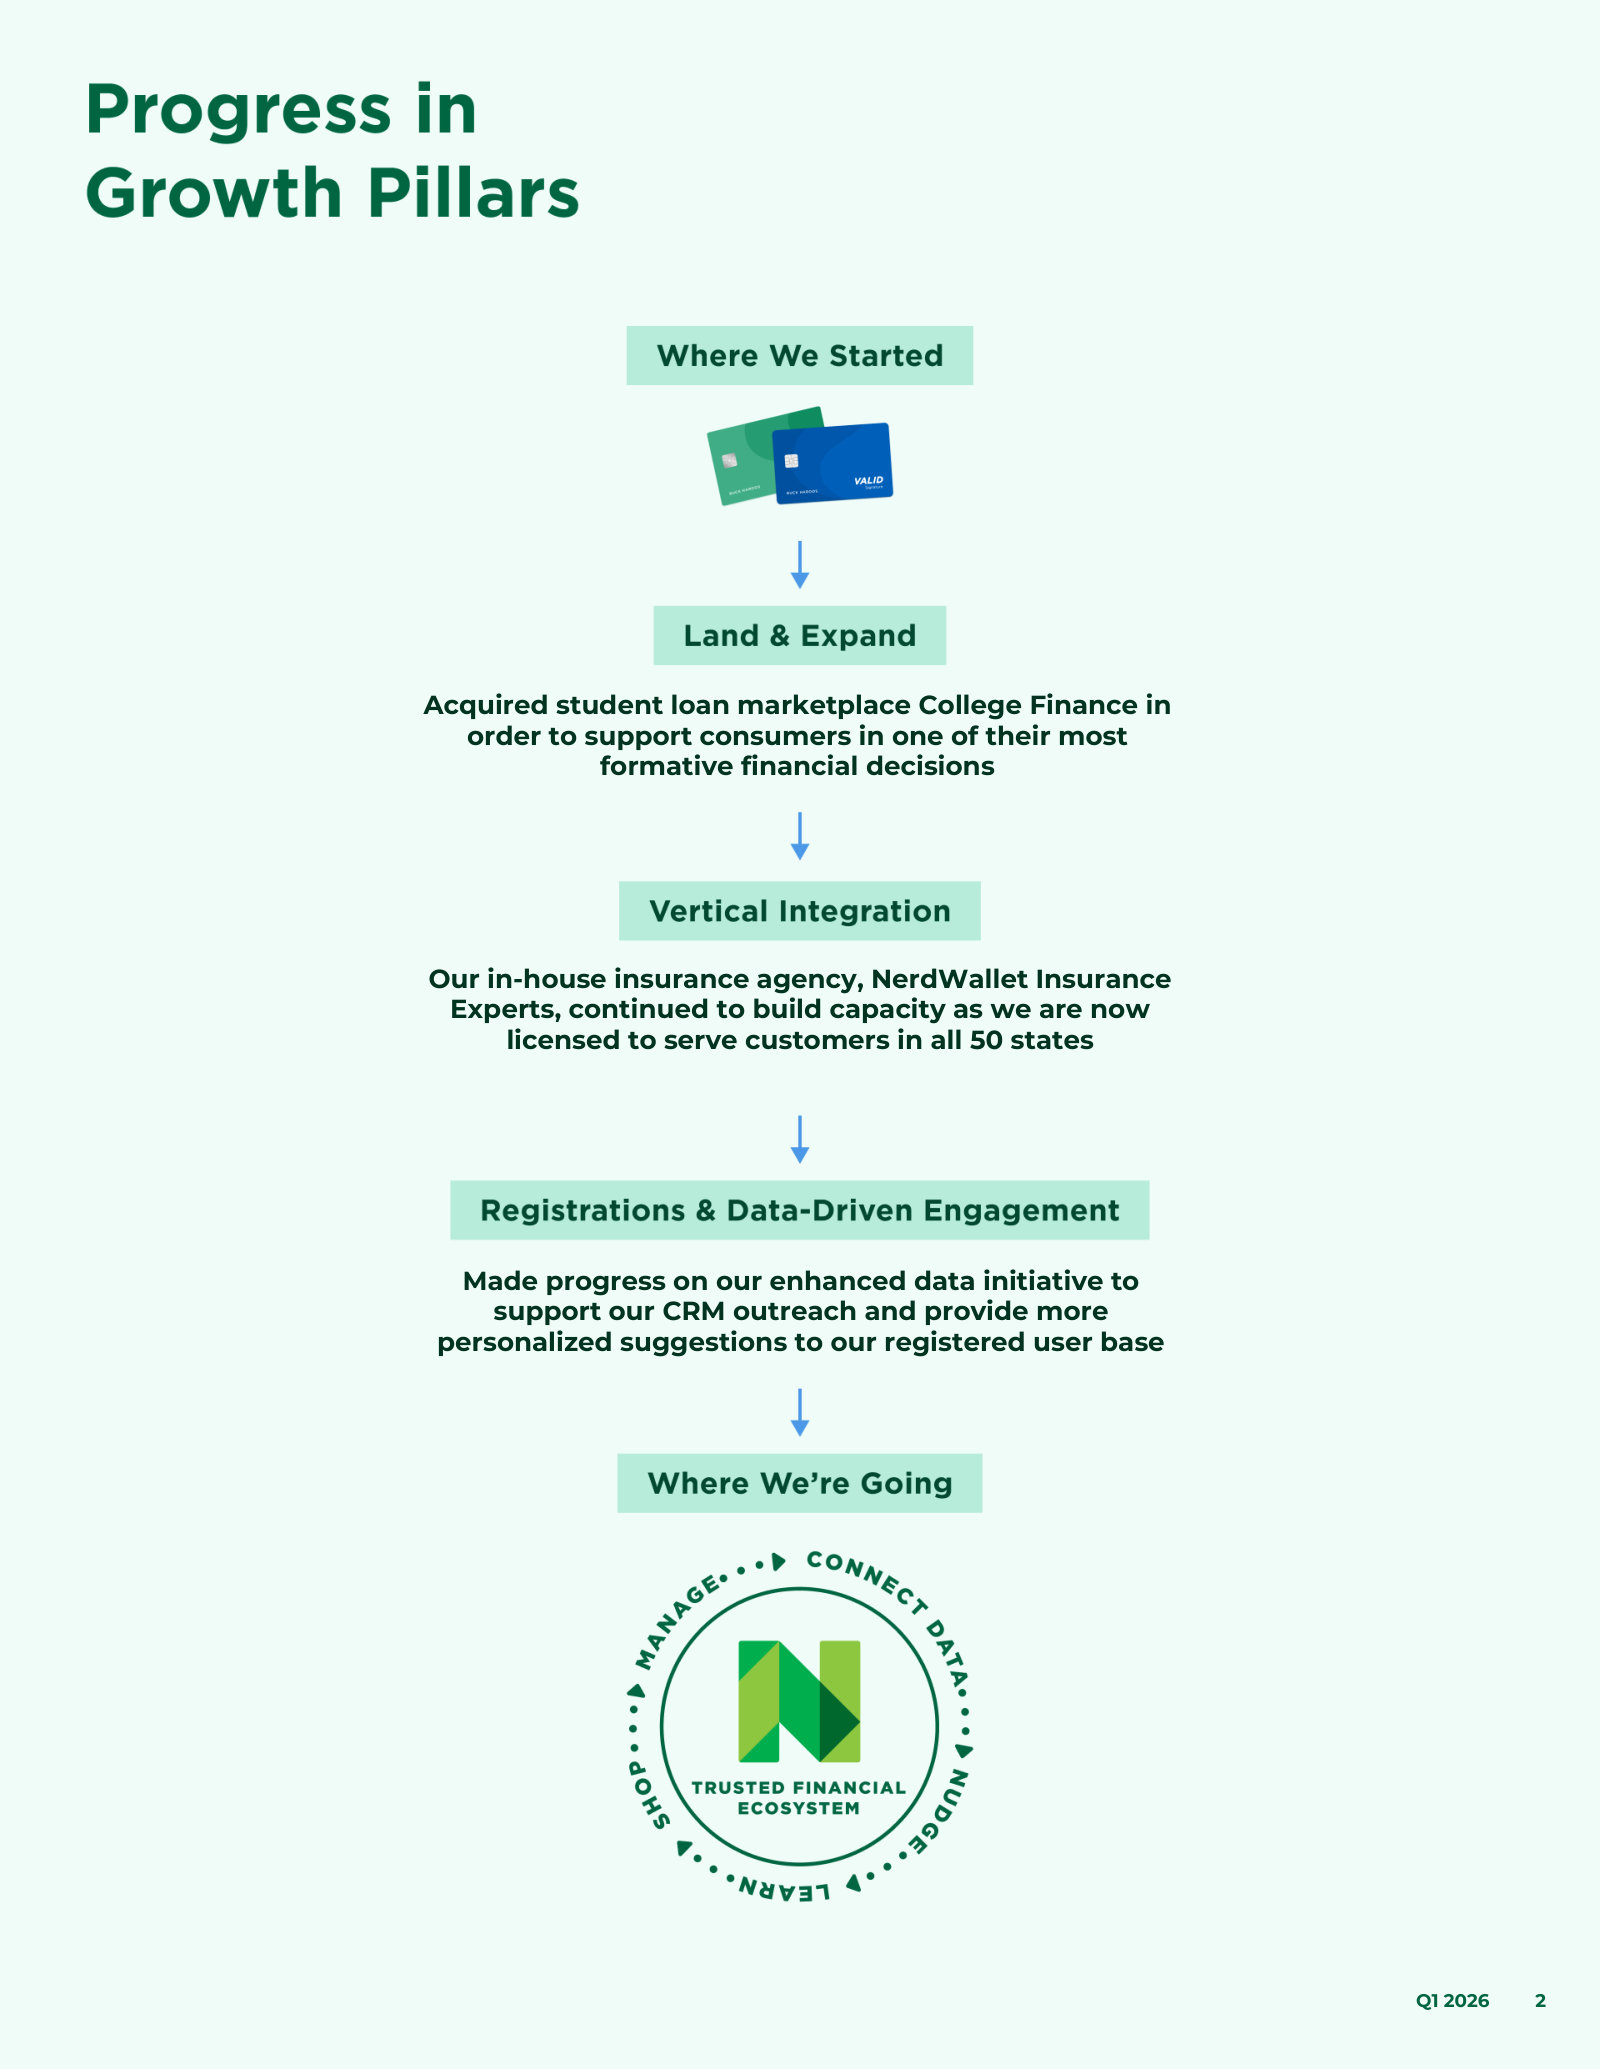
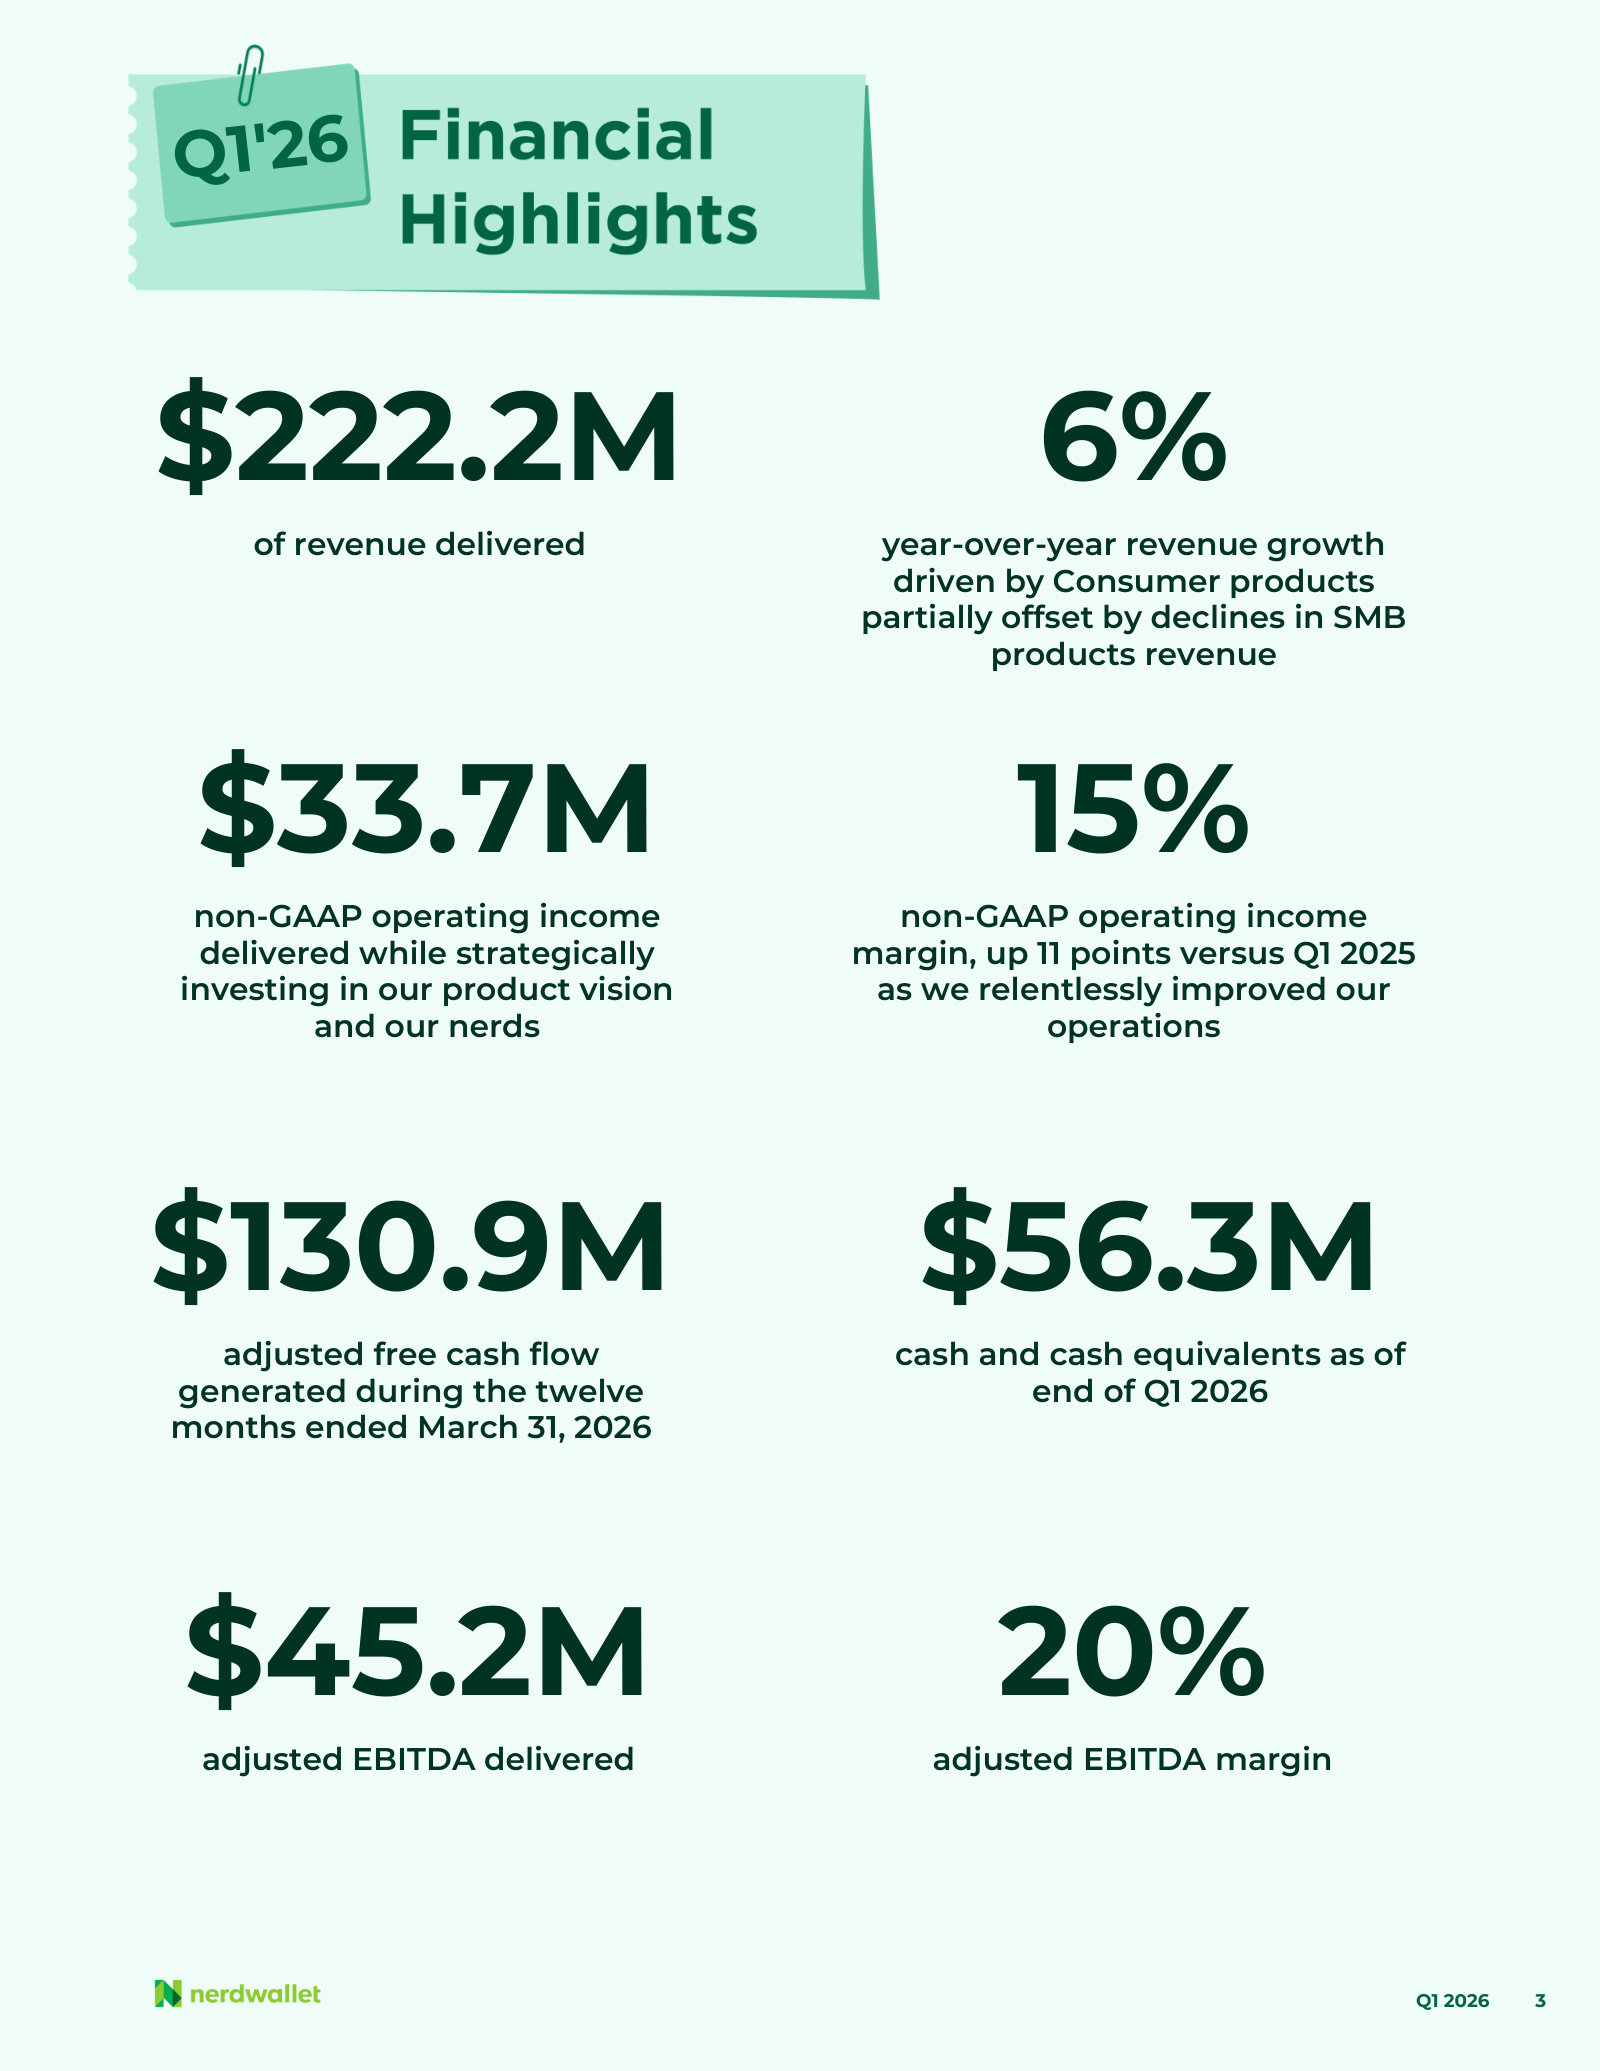
NerdWallet, Inc.'s management explains the business in its own materials. The slides below do the most of that work, pulled from the documents preserved in Sources. Each source link opens the complete presentation at that slide in a new tab.
Investor Presentation — March 2024
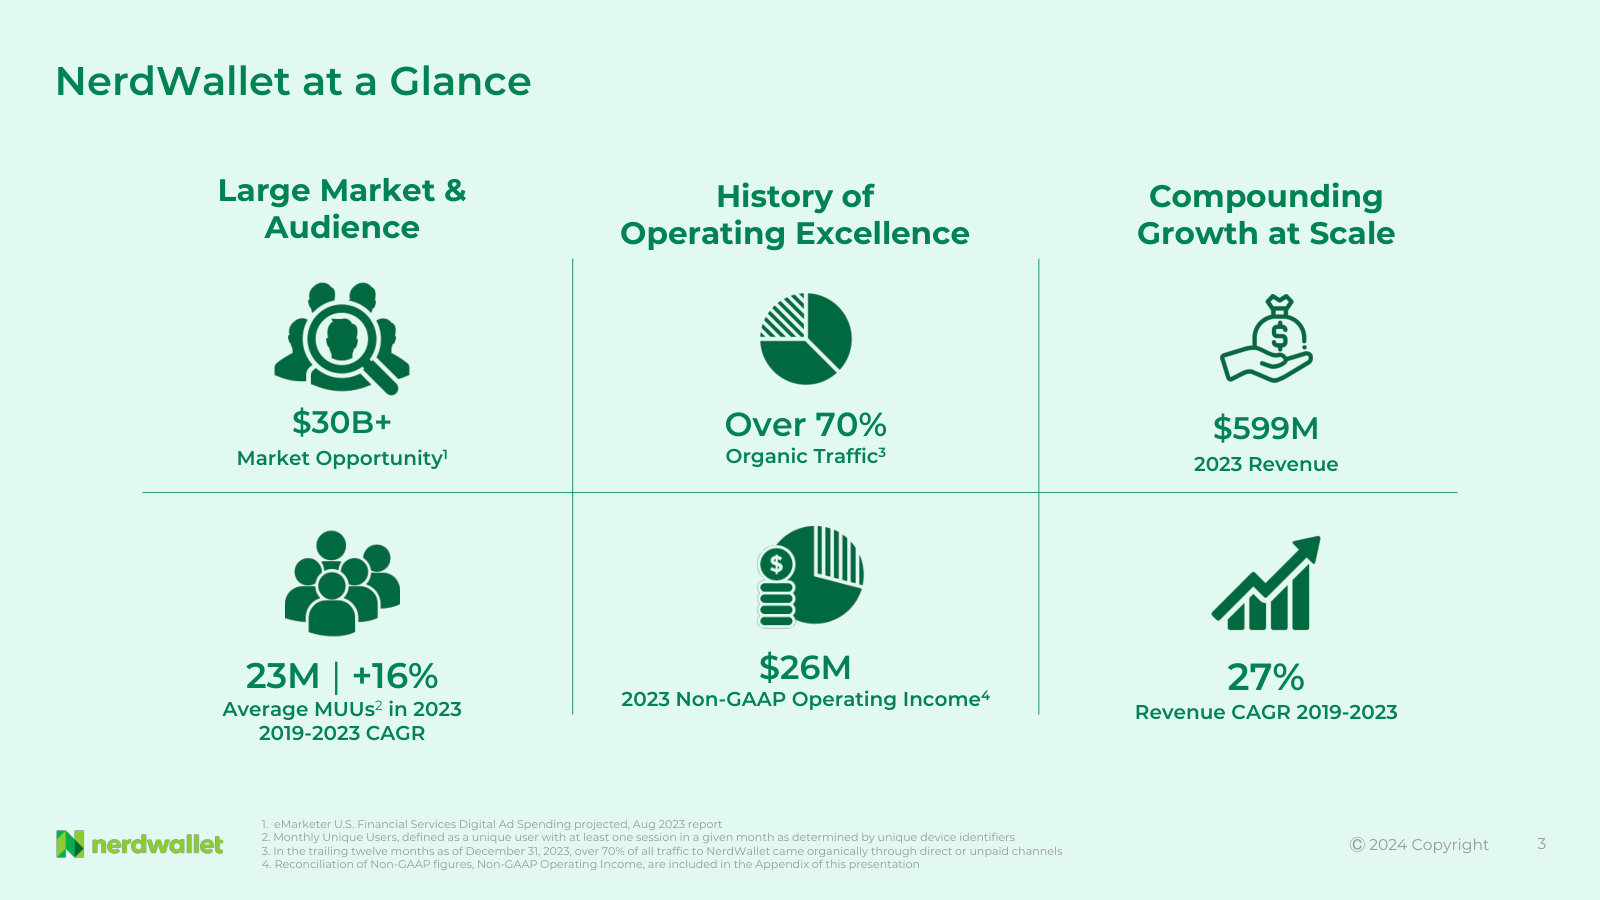
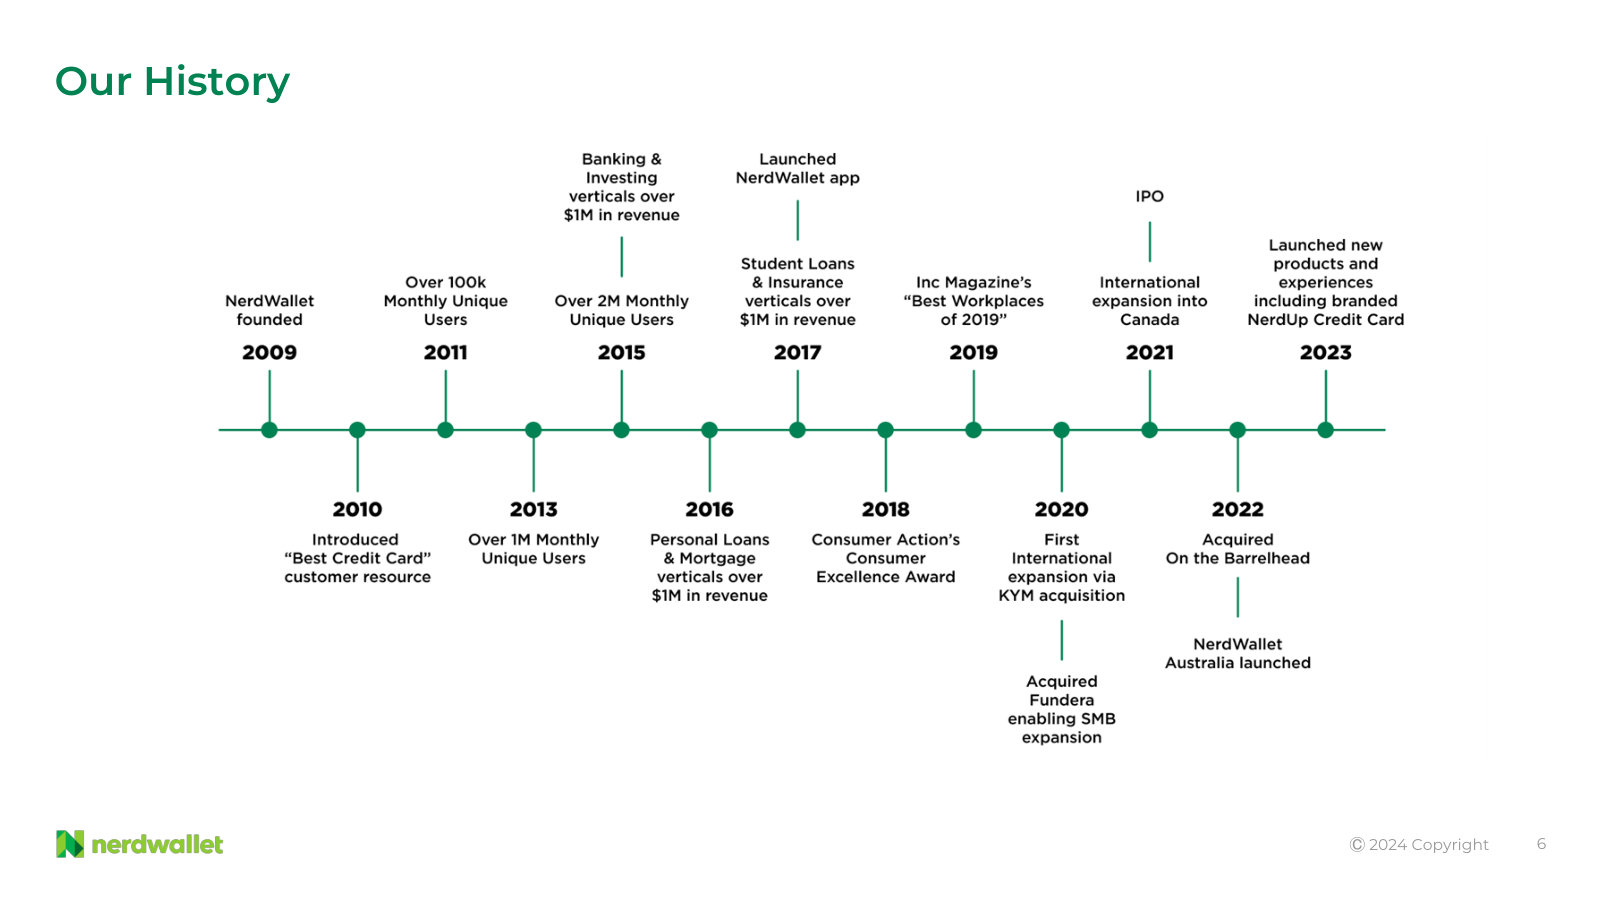
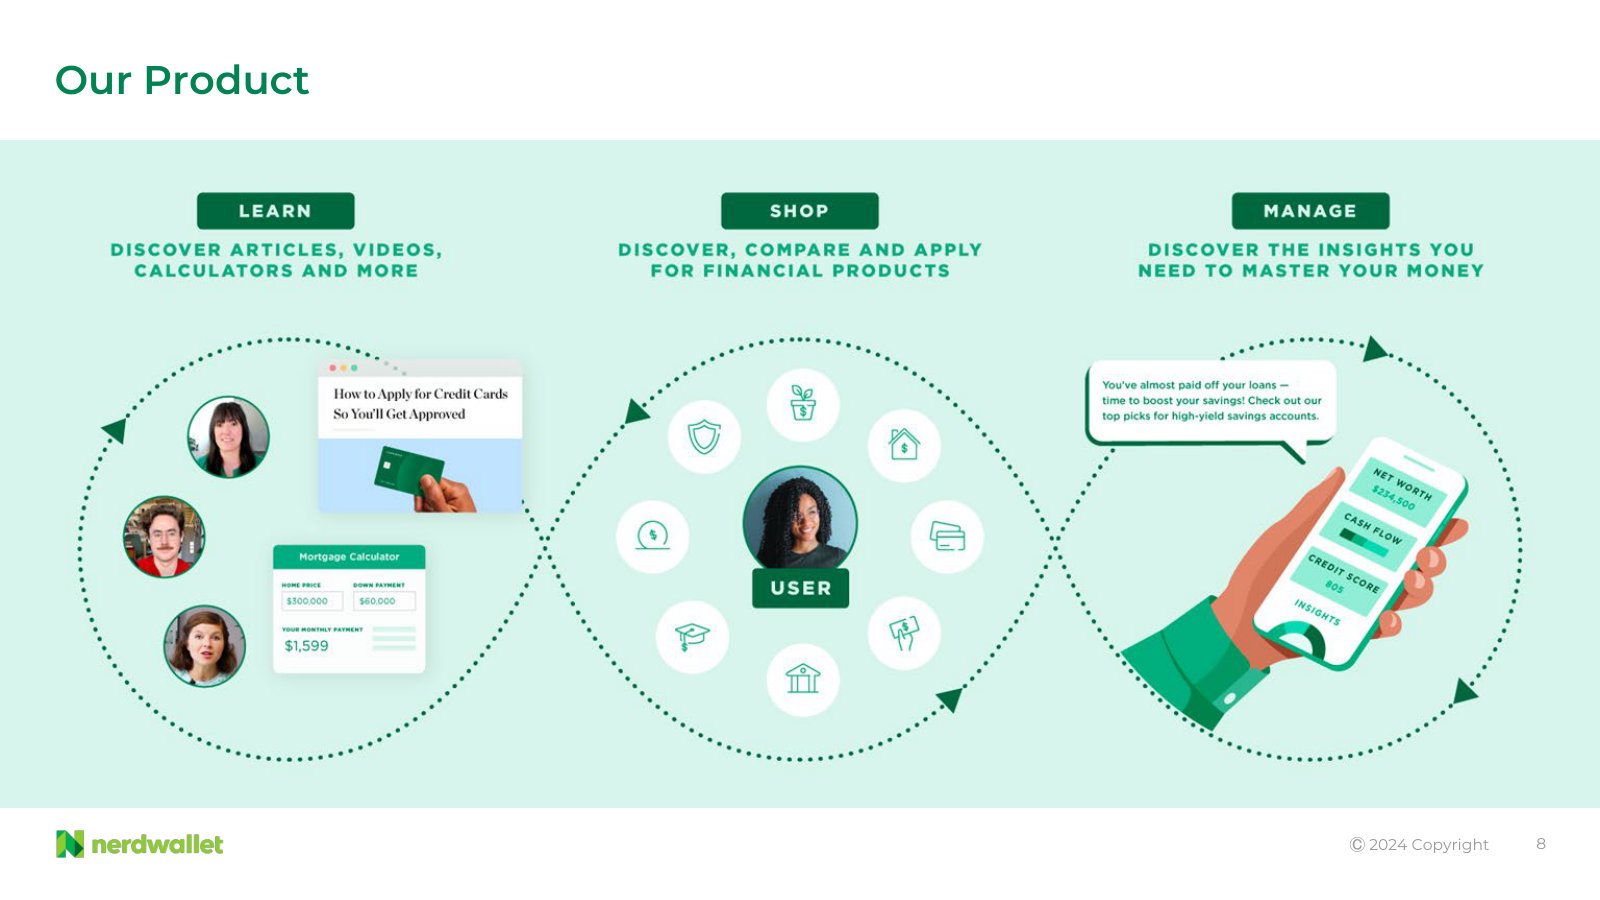
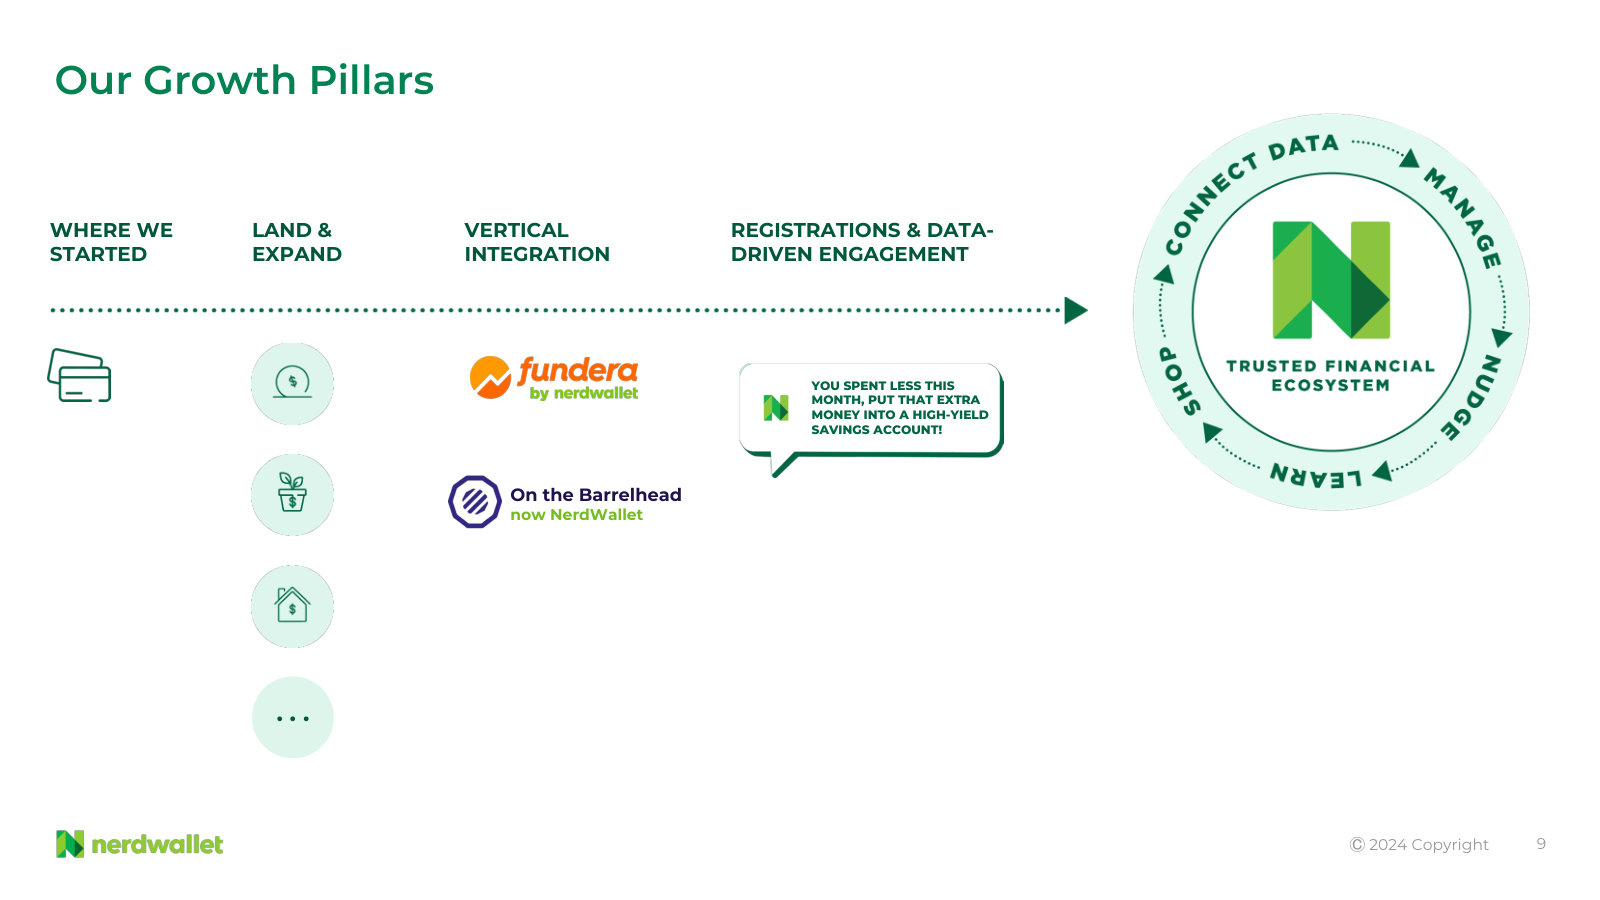
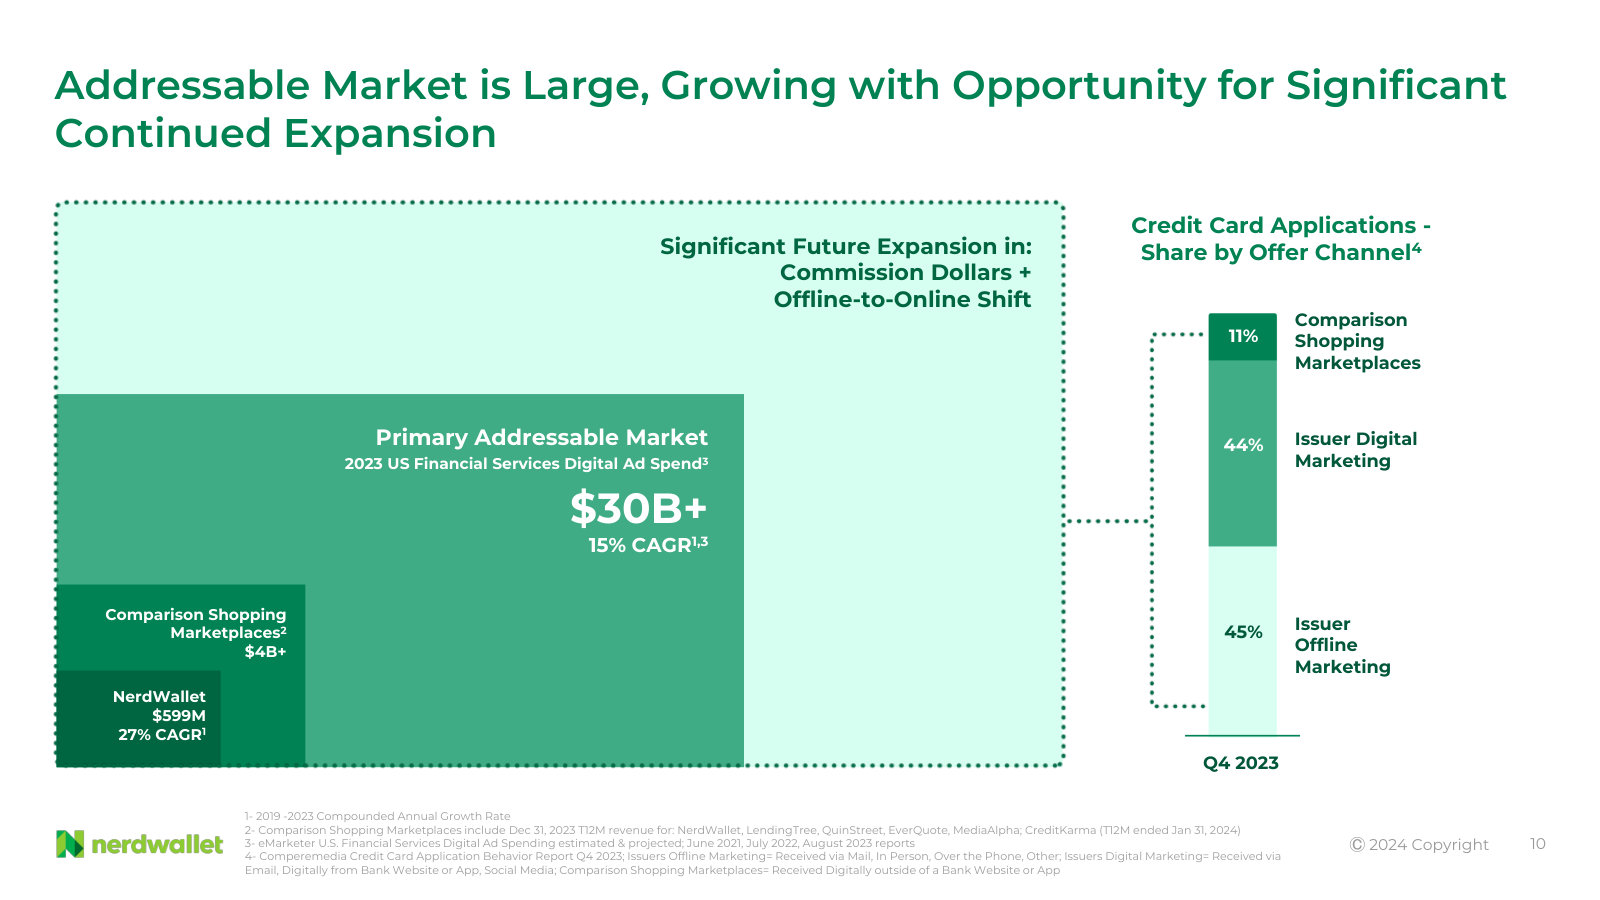
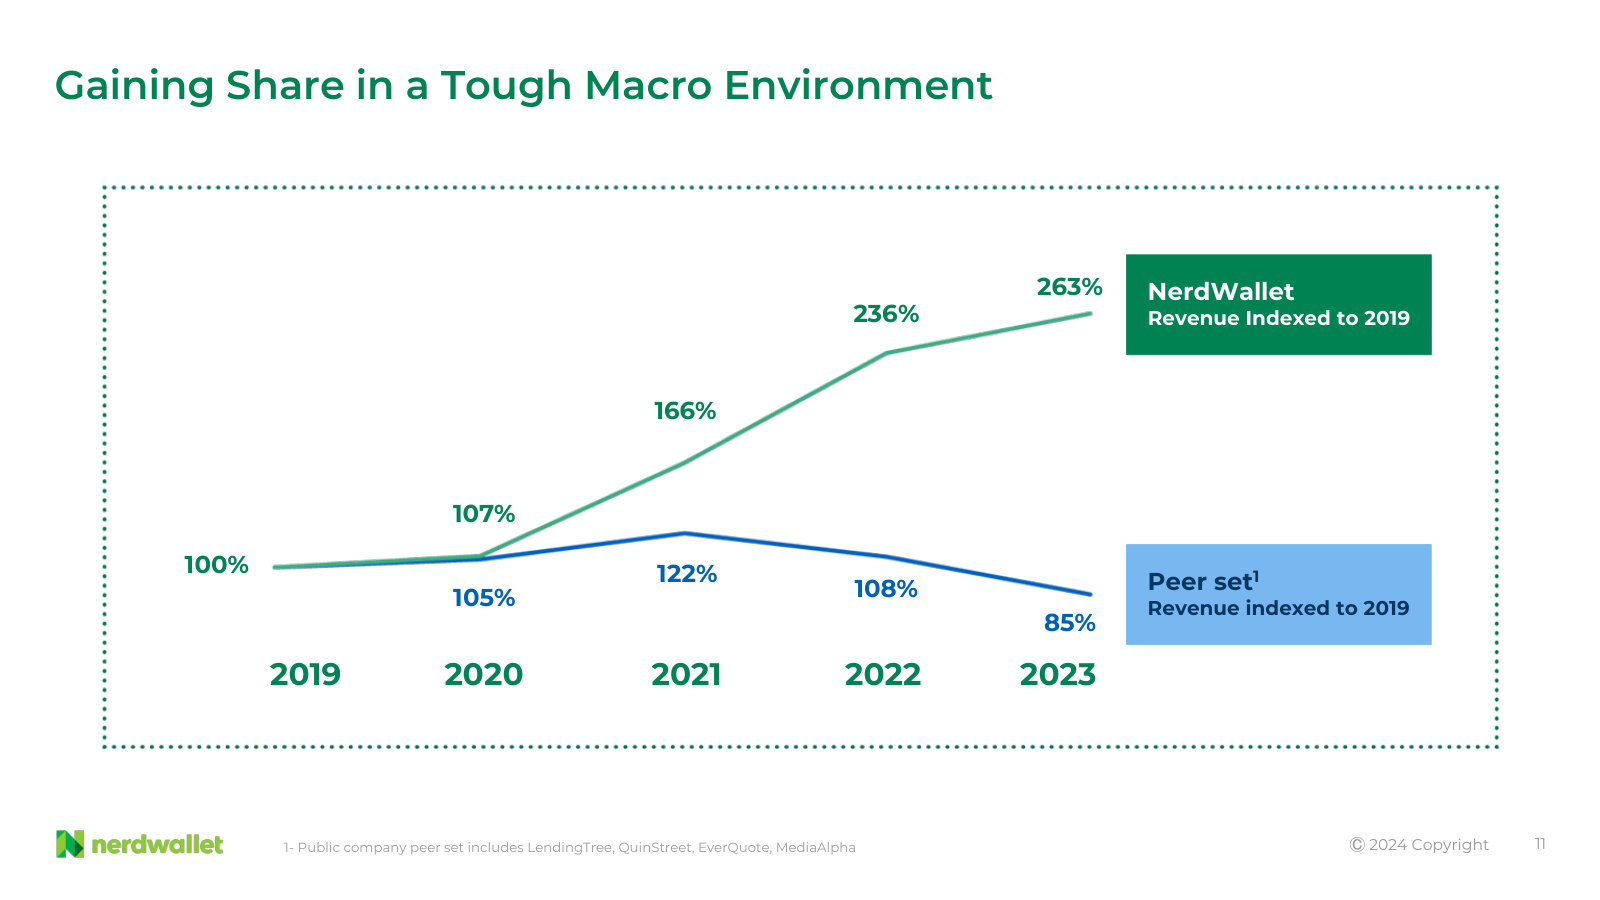
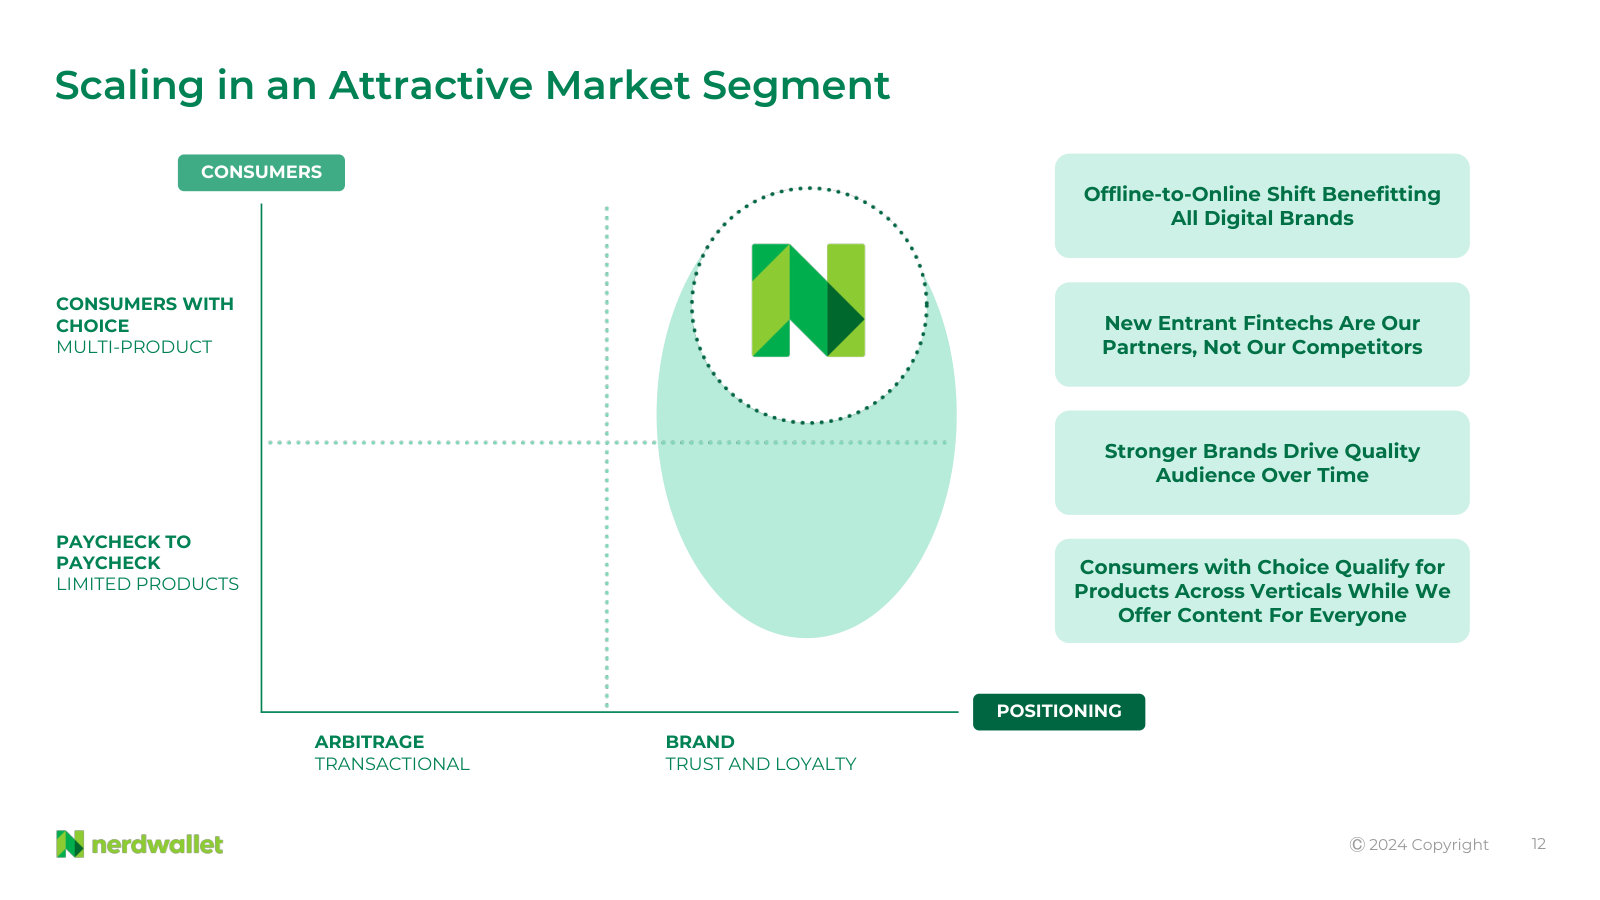
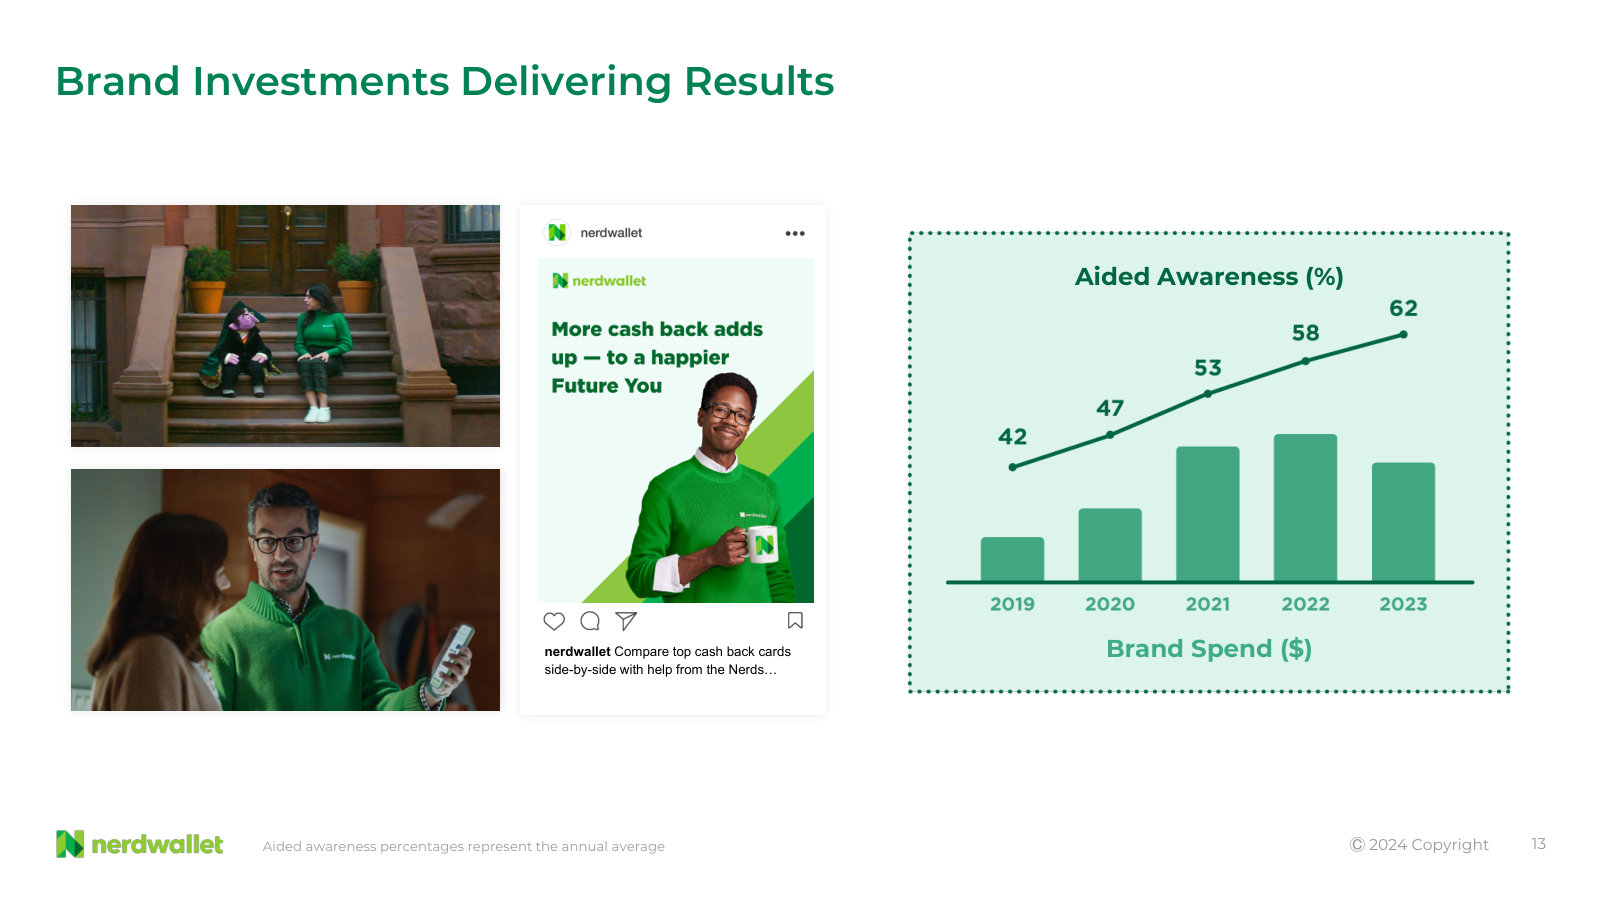
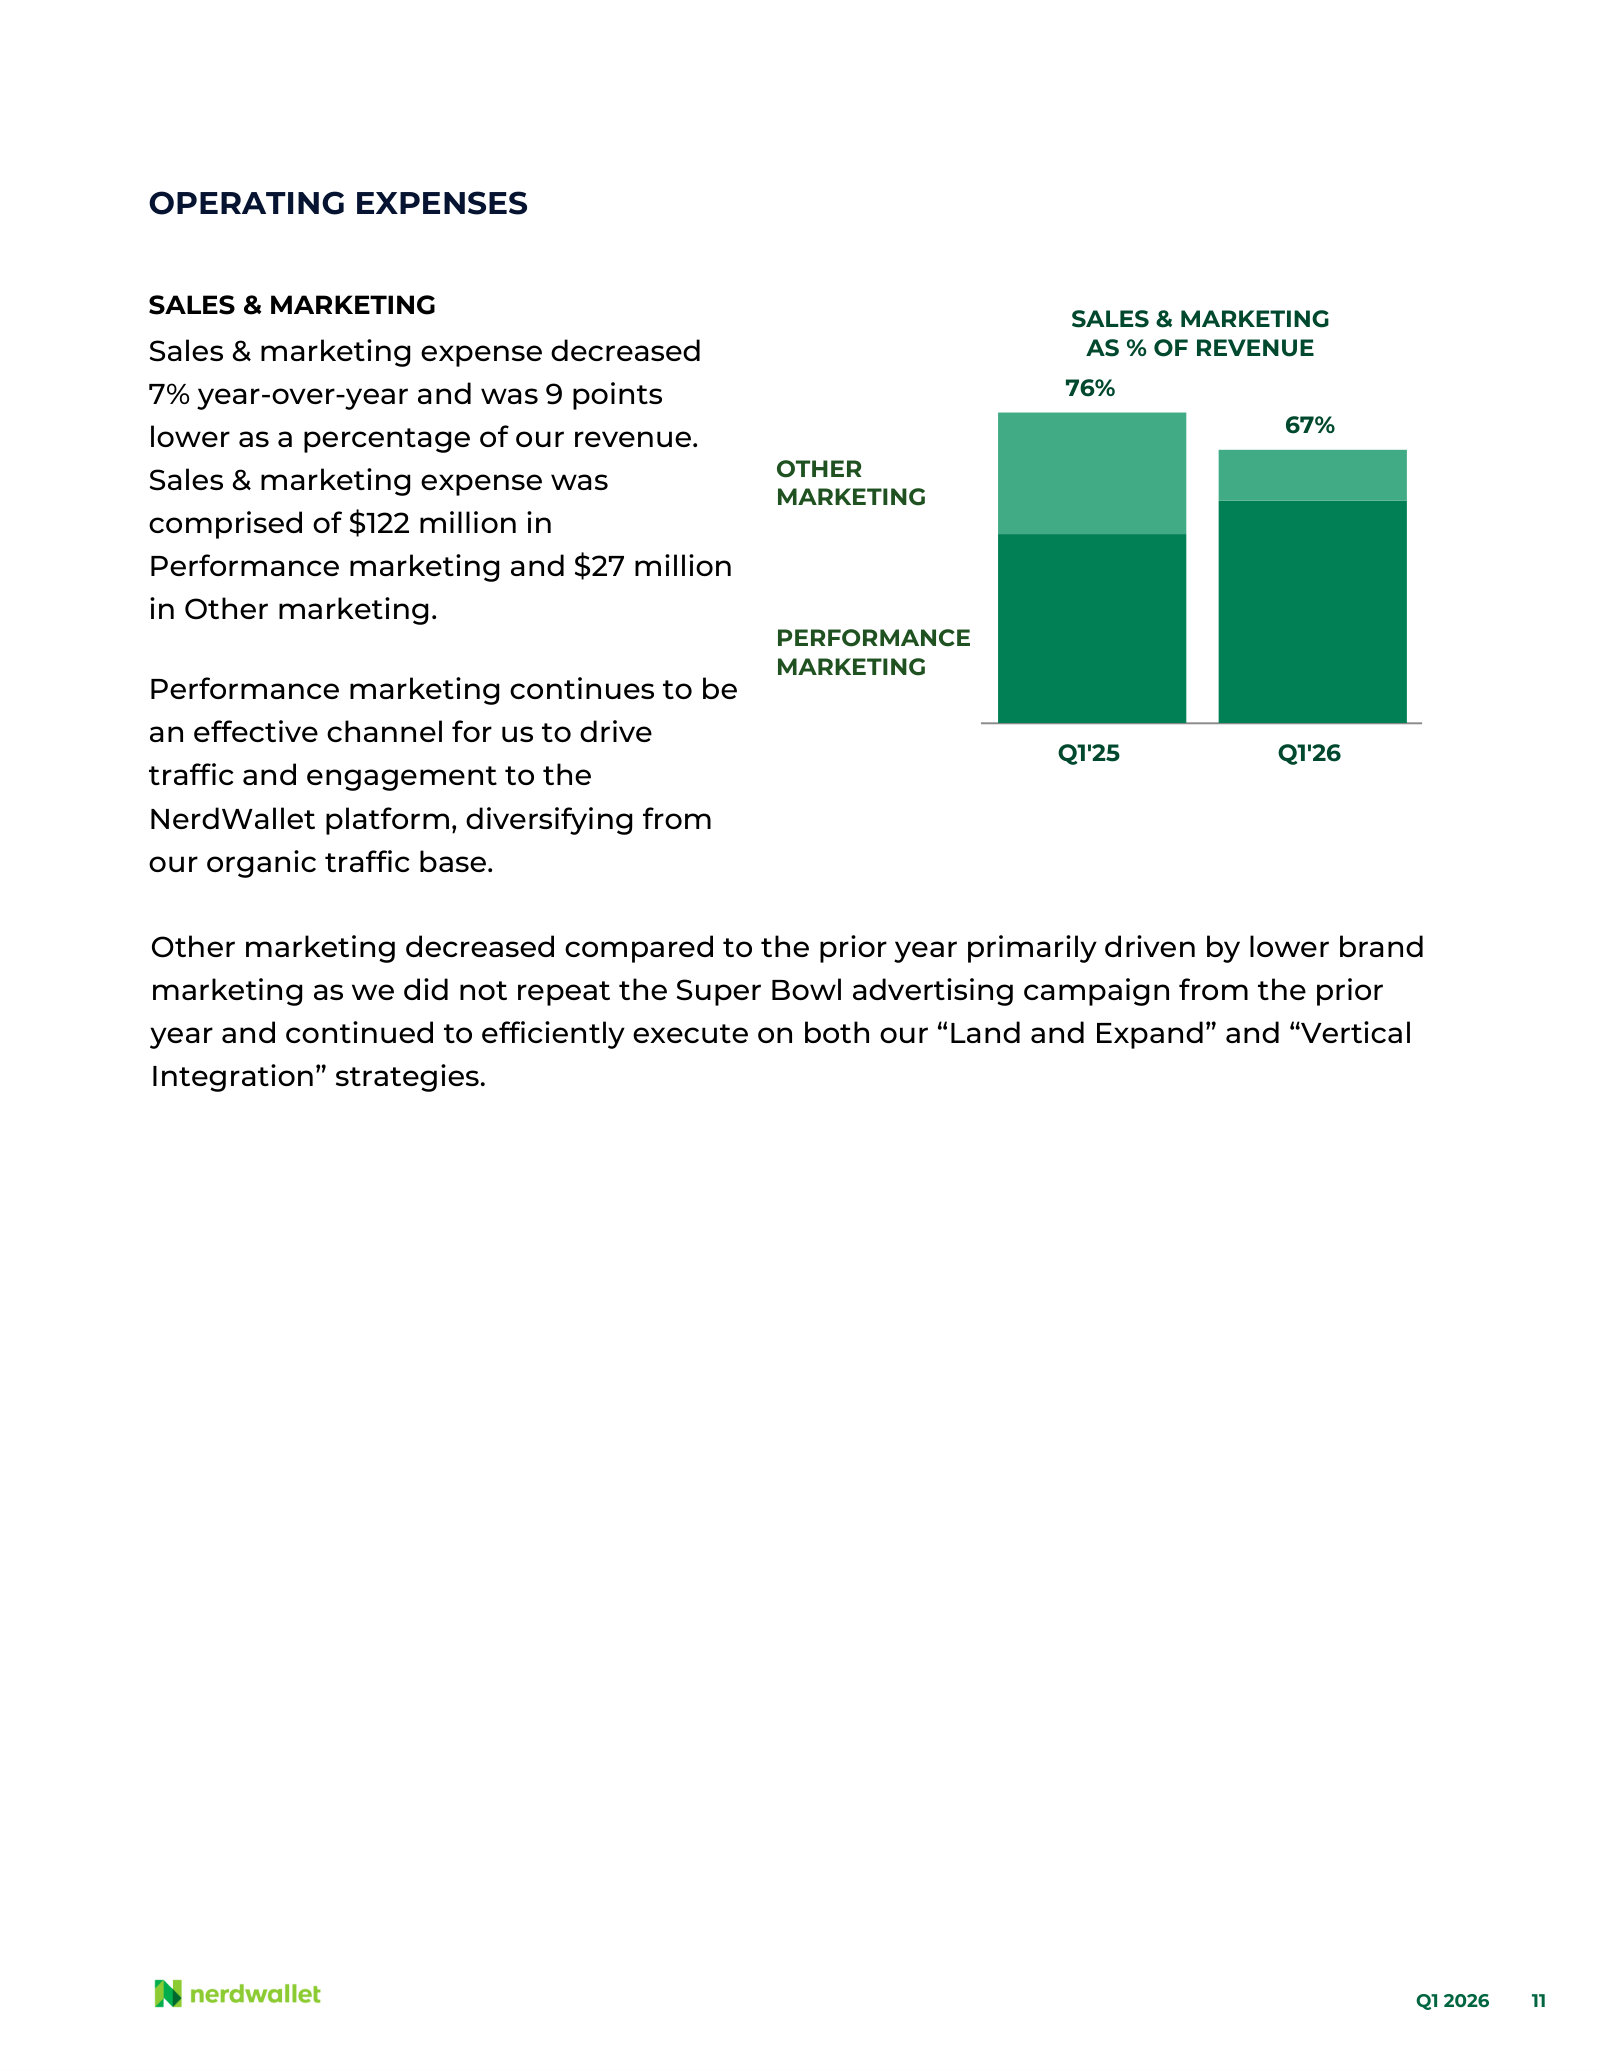
The only standalone company-overview deck here: business model, market structure, unit economics and the 2026 targets, drawn rather than written. · Open the full document →
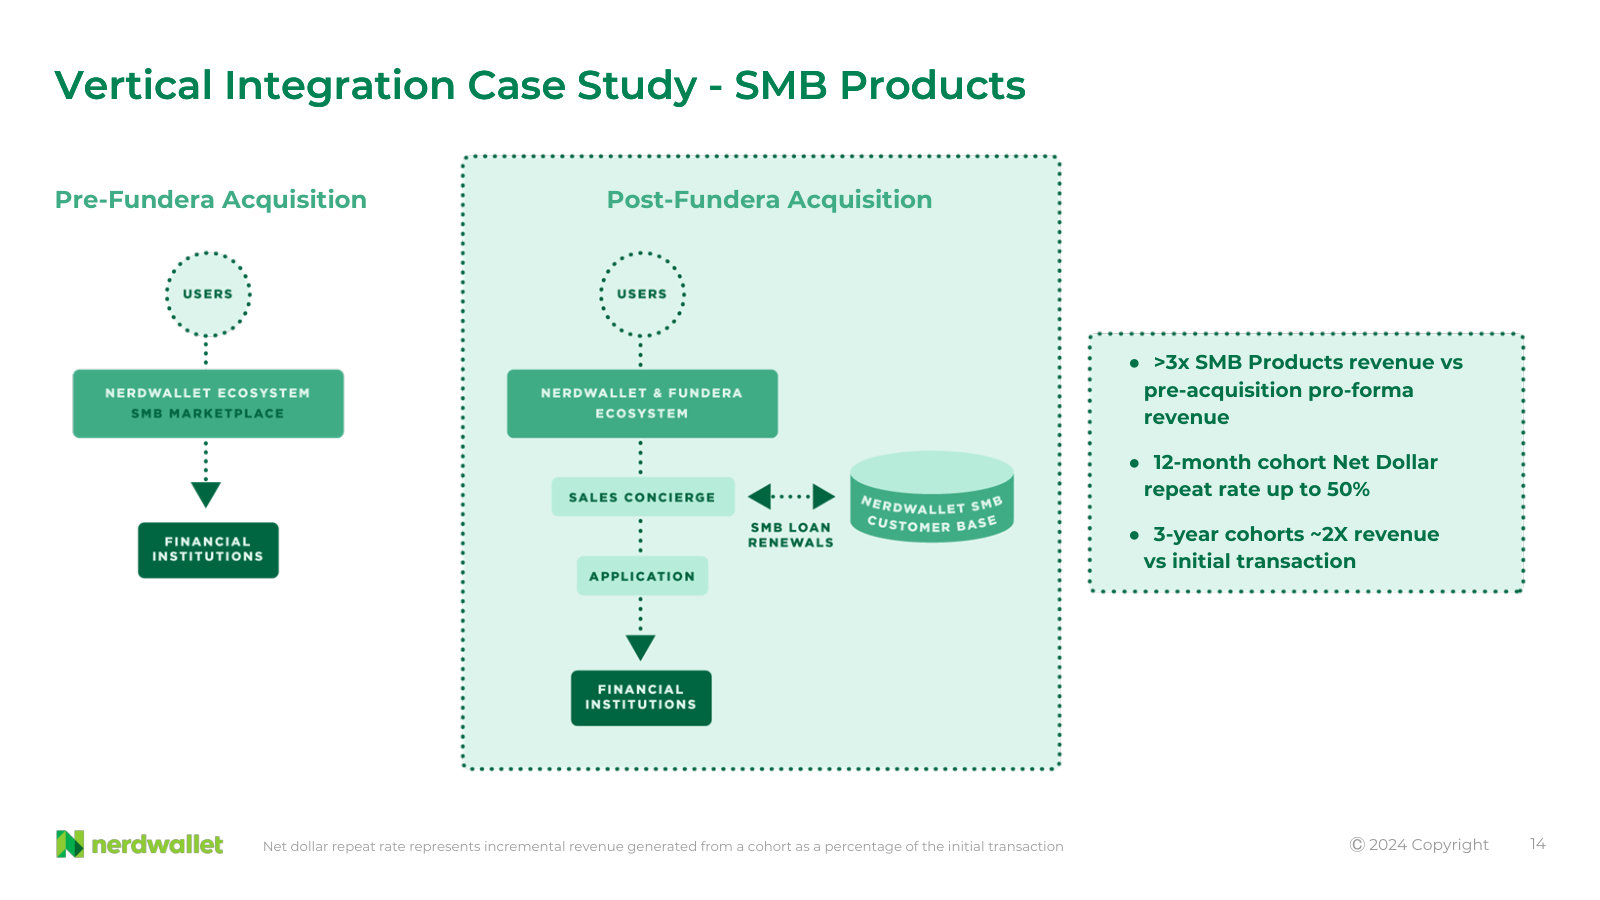
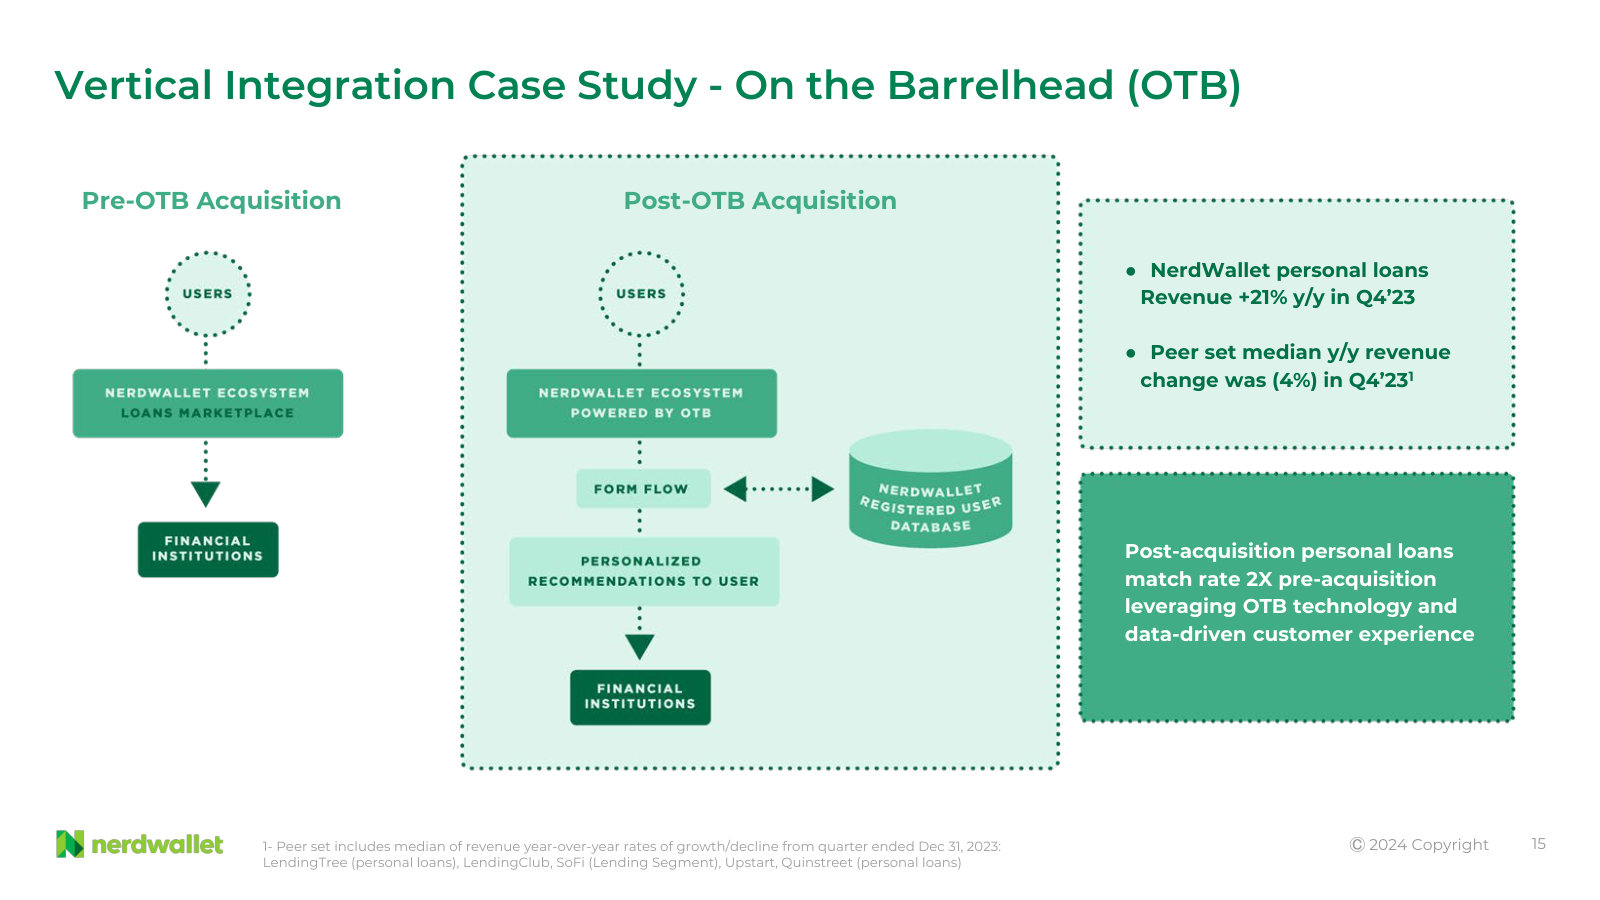
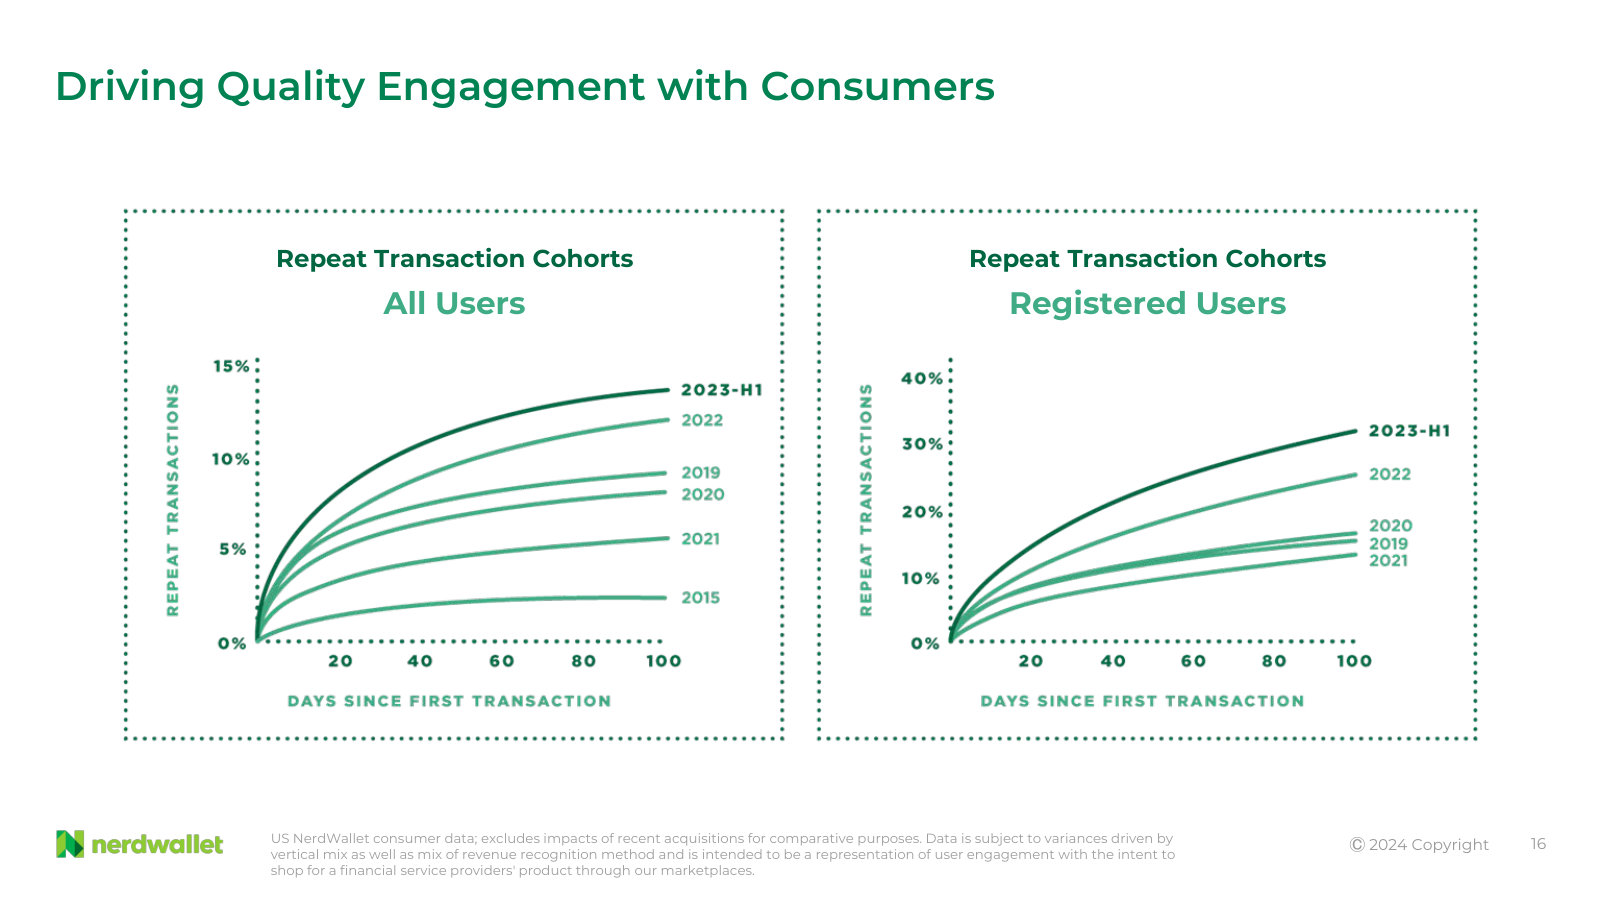
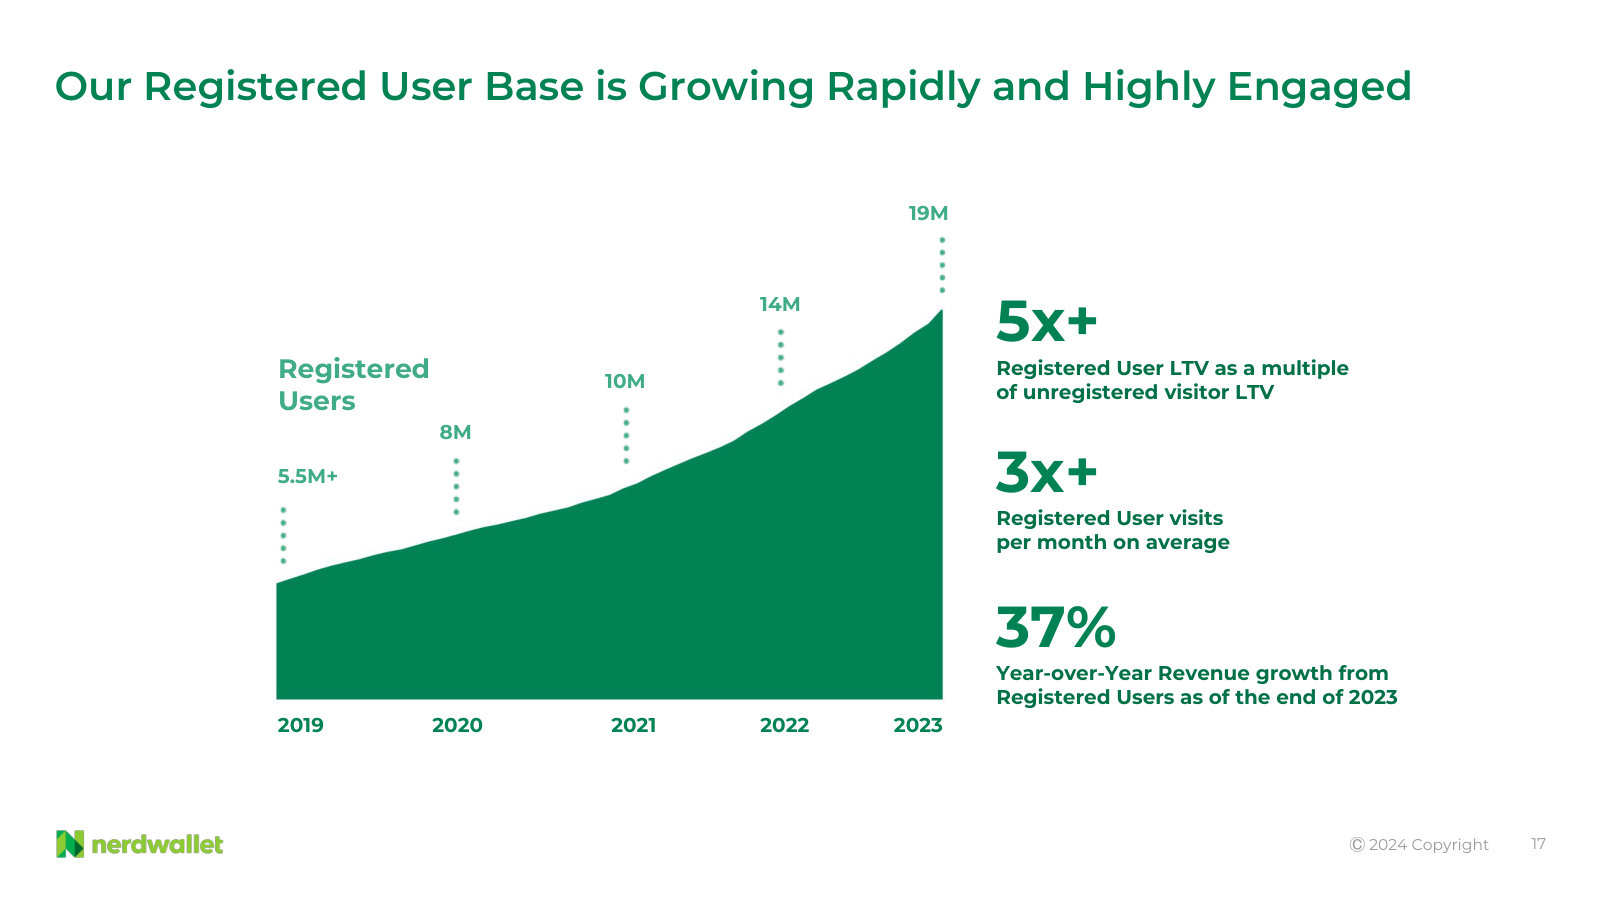
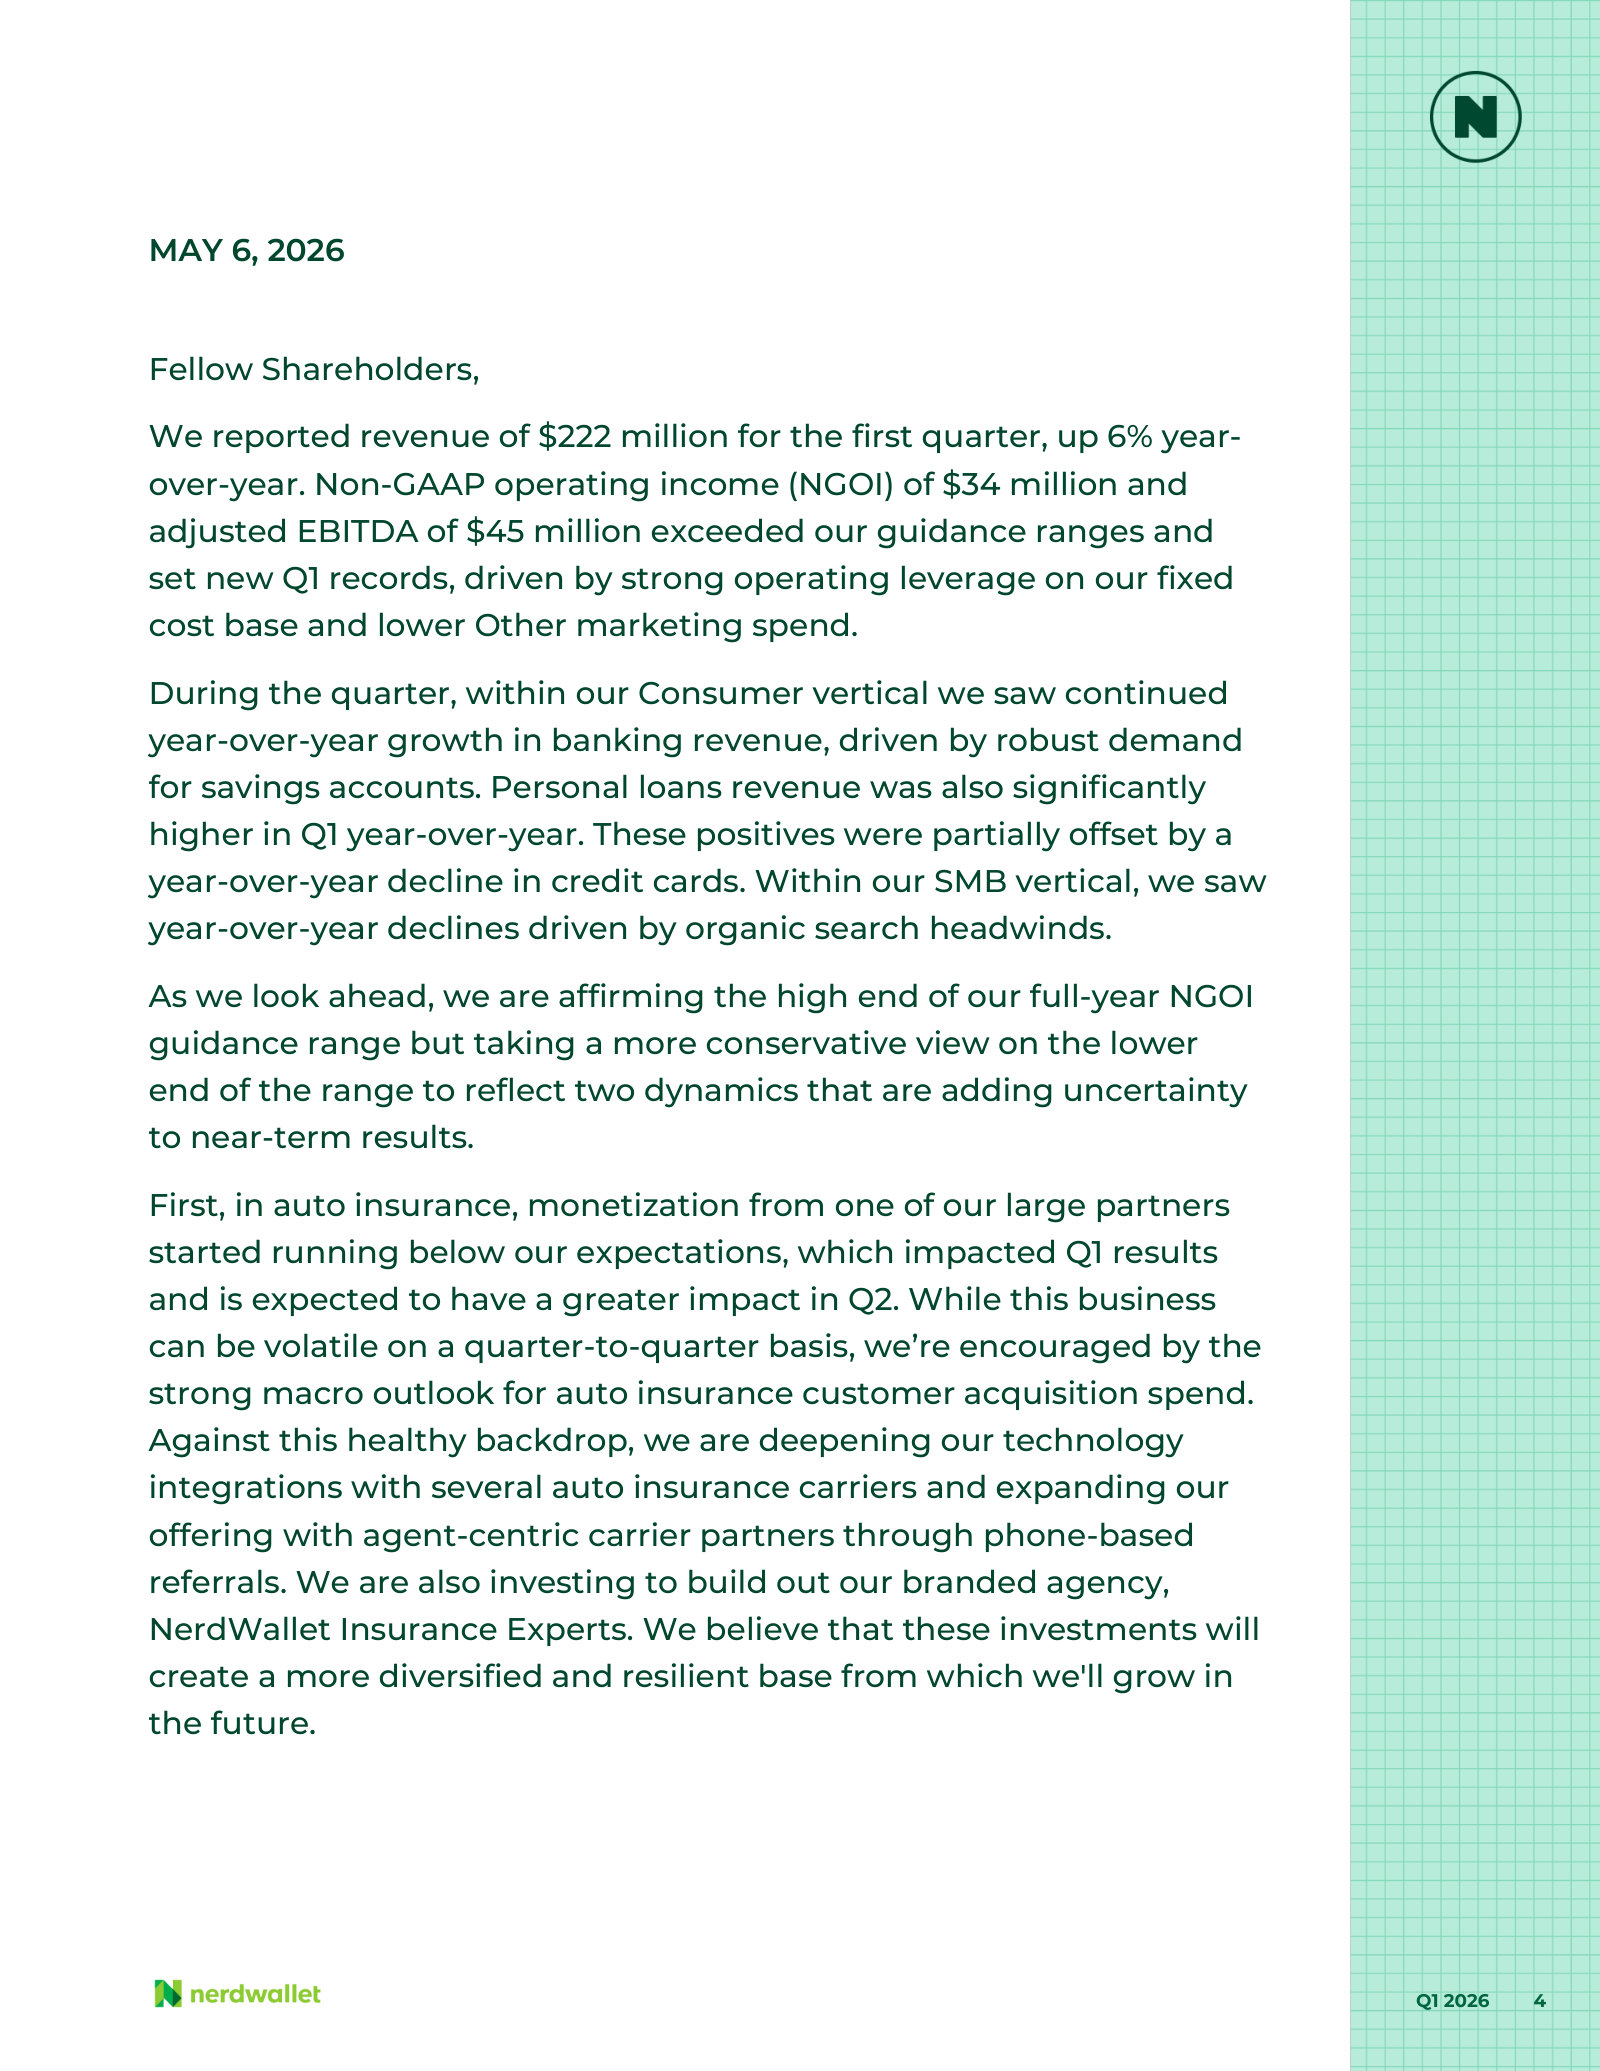
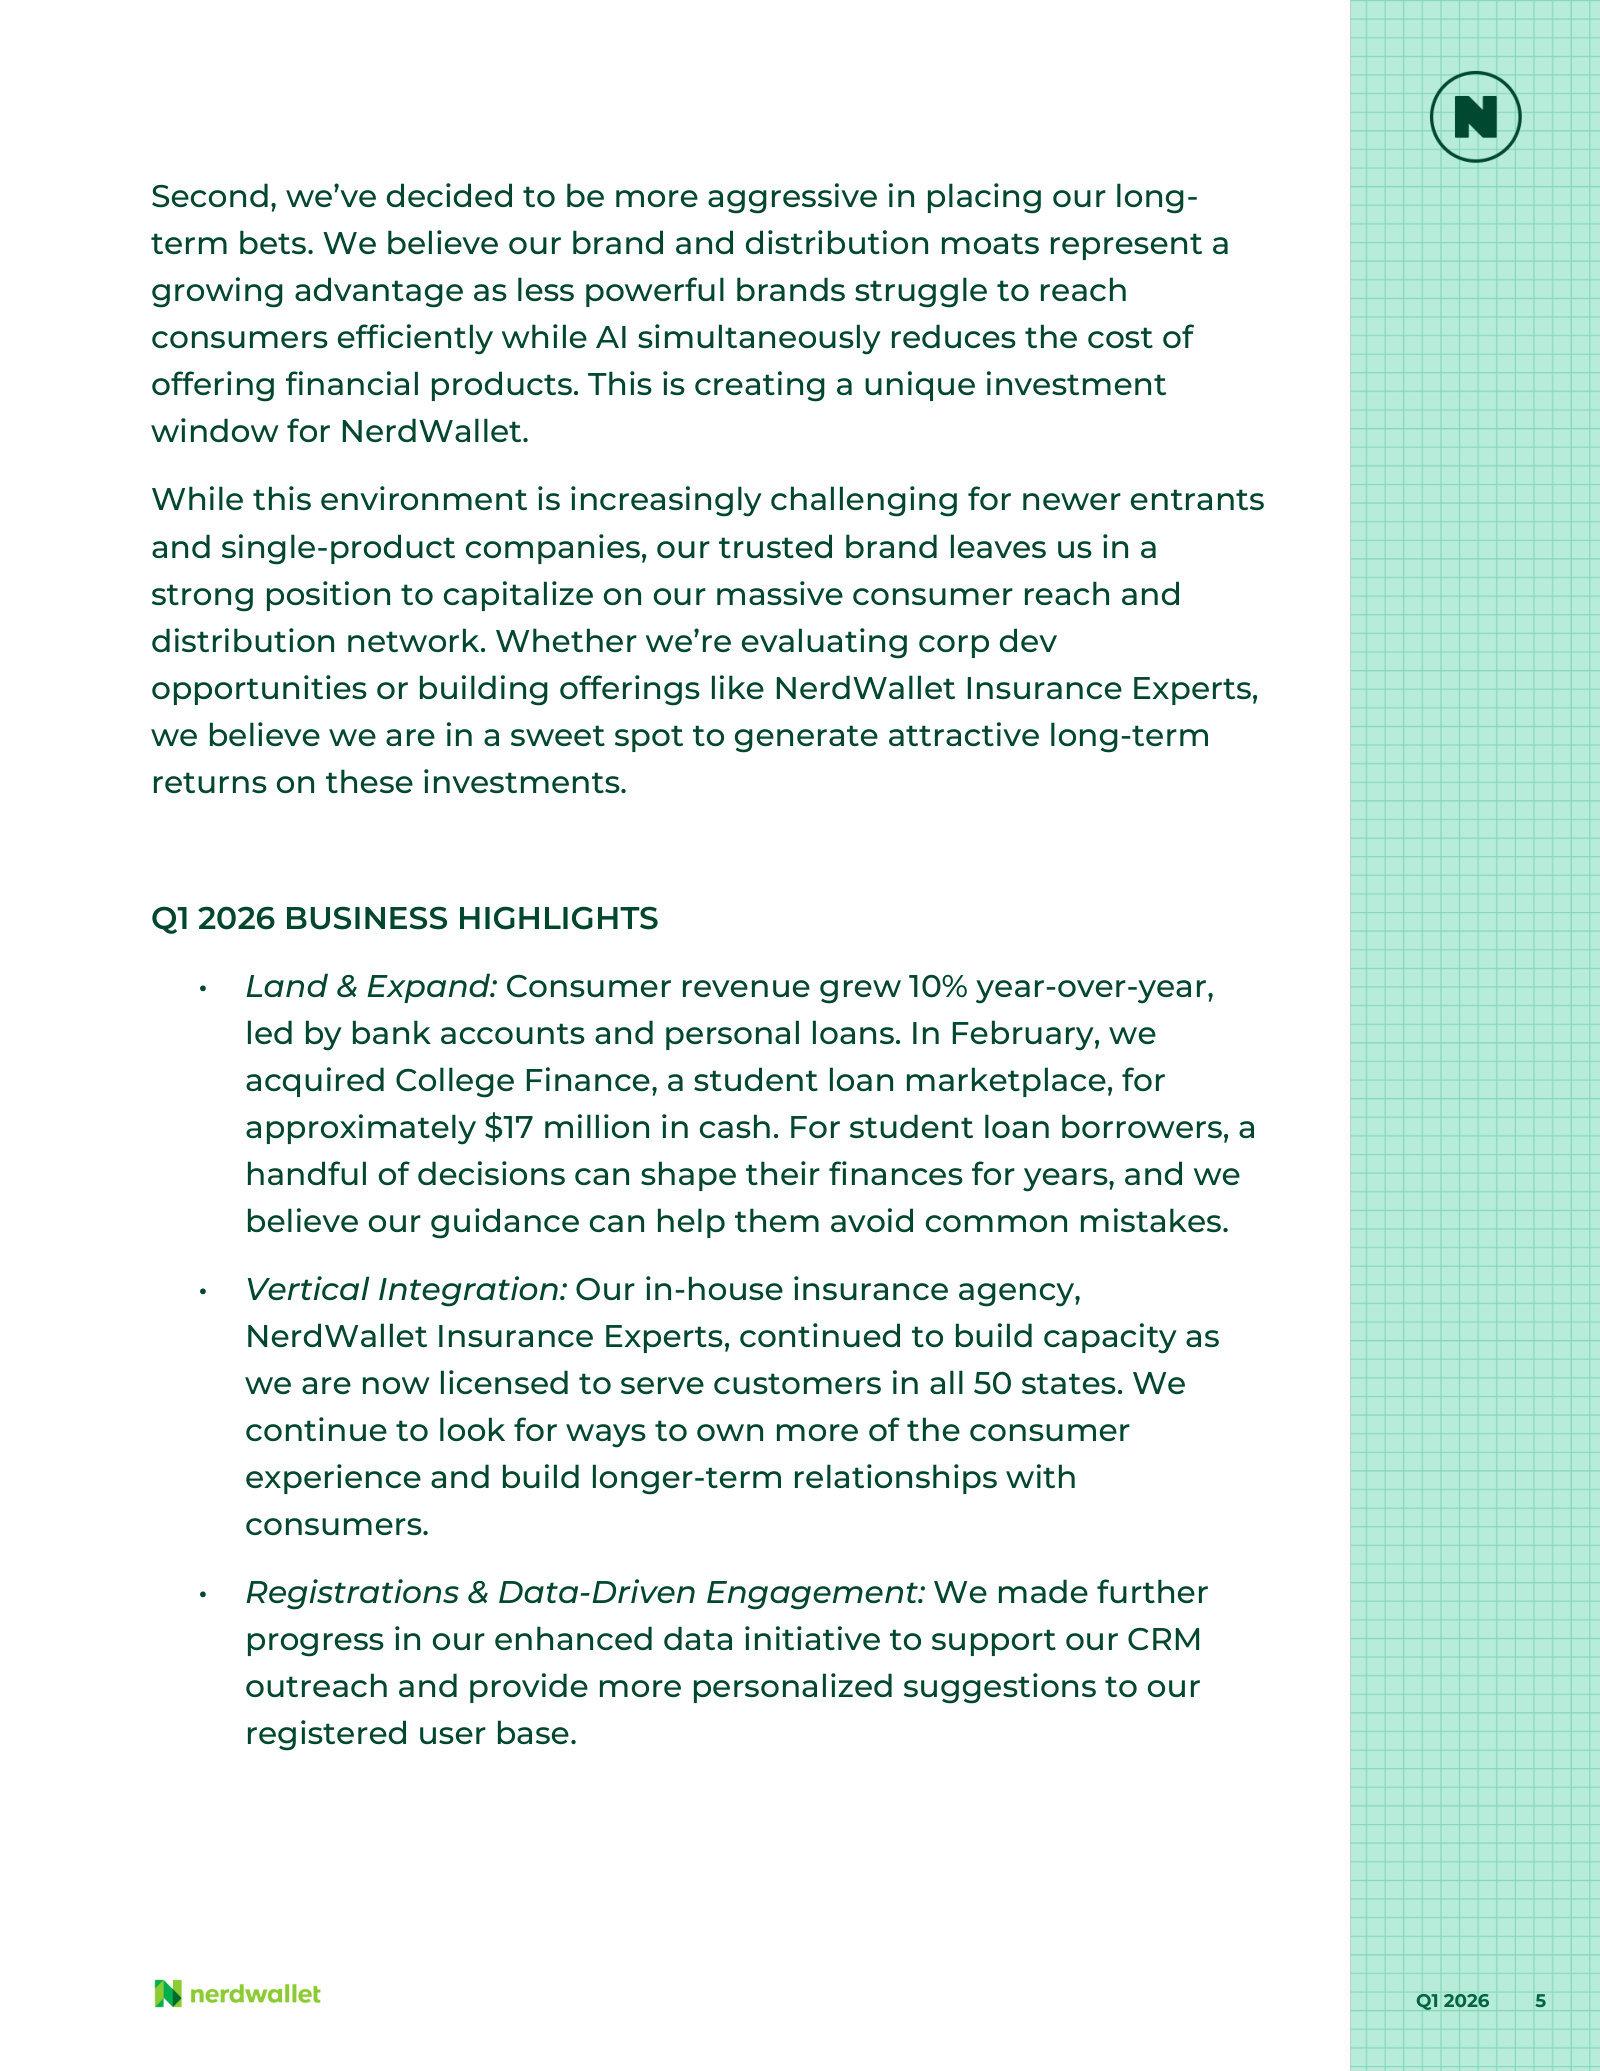
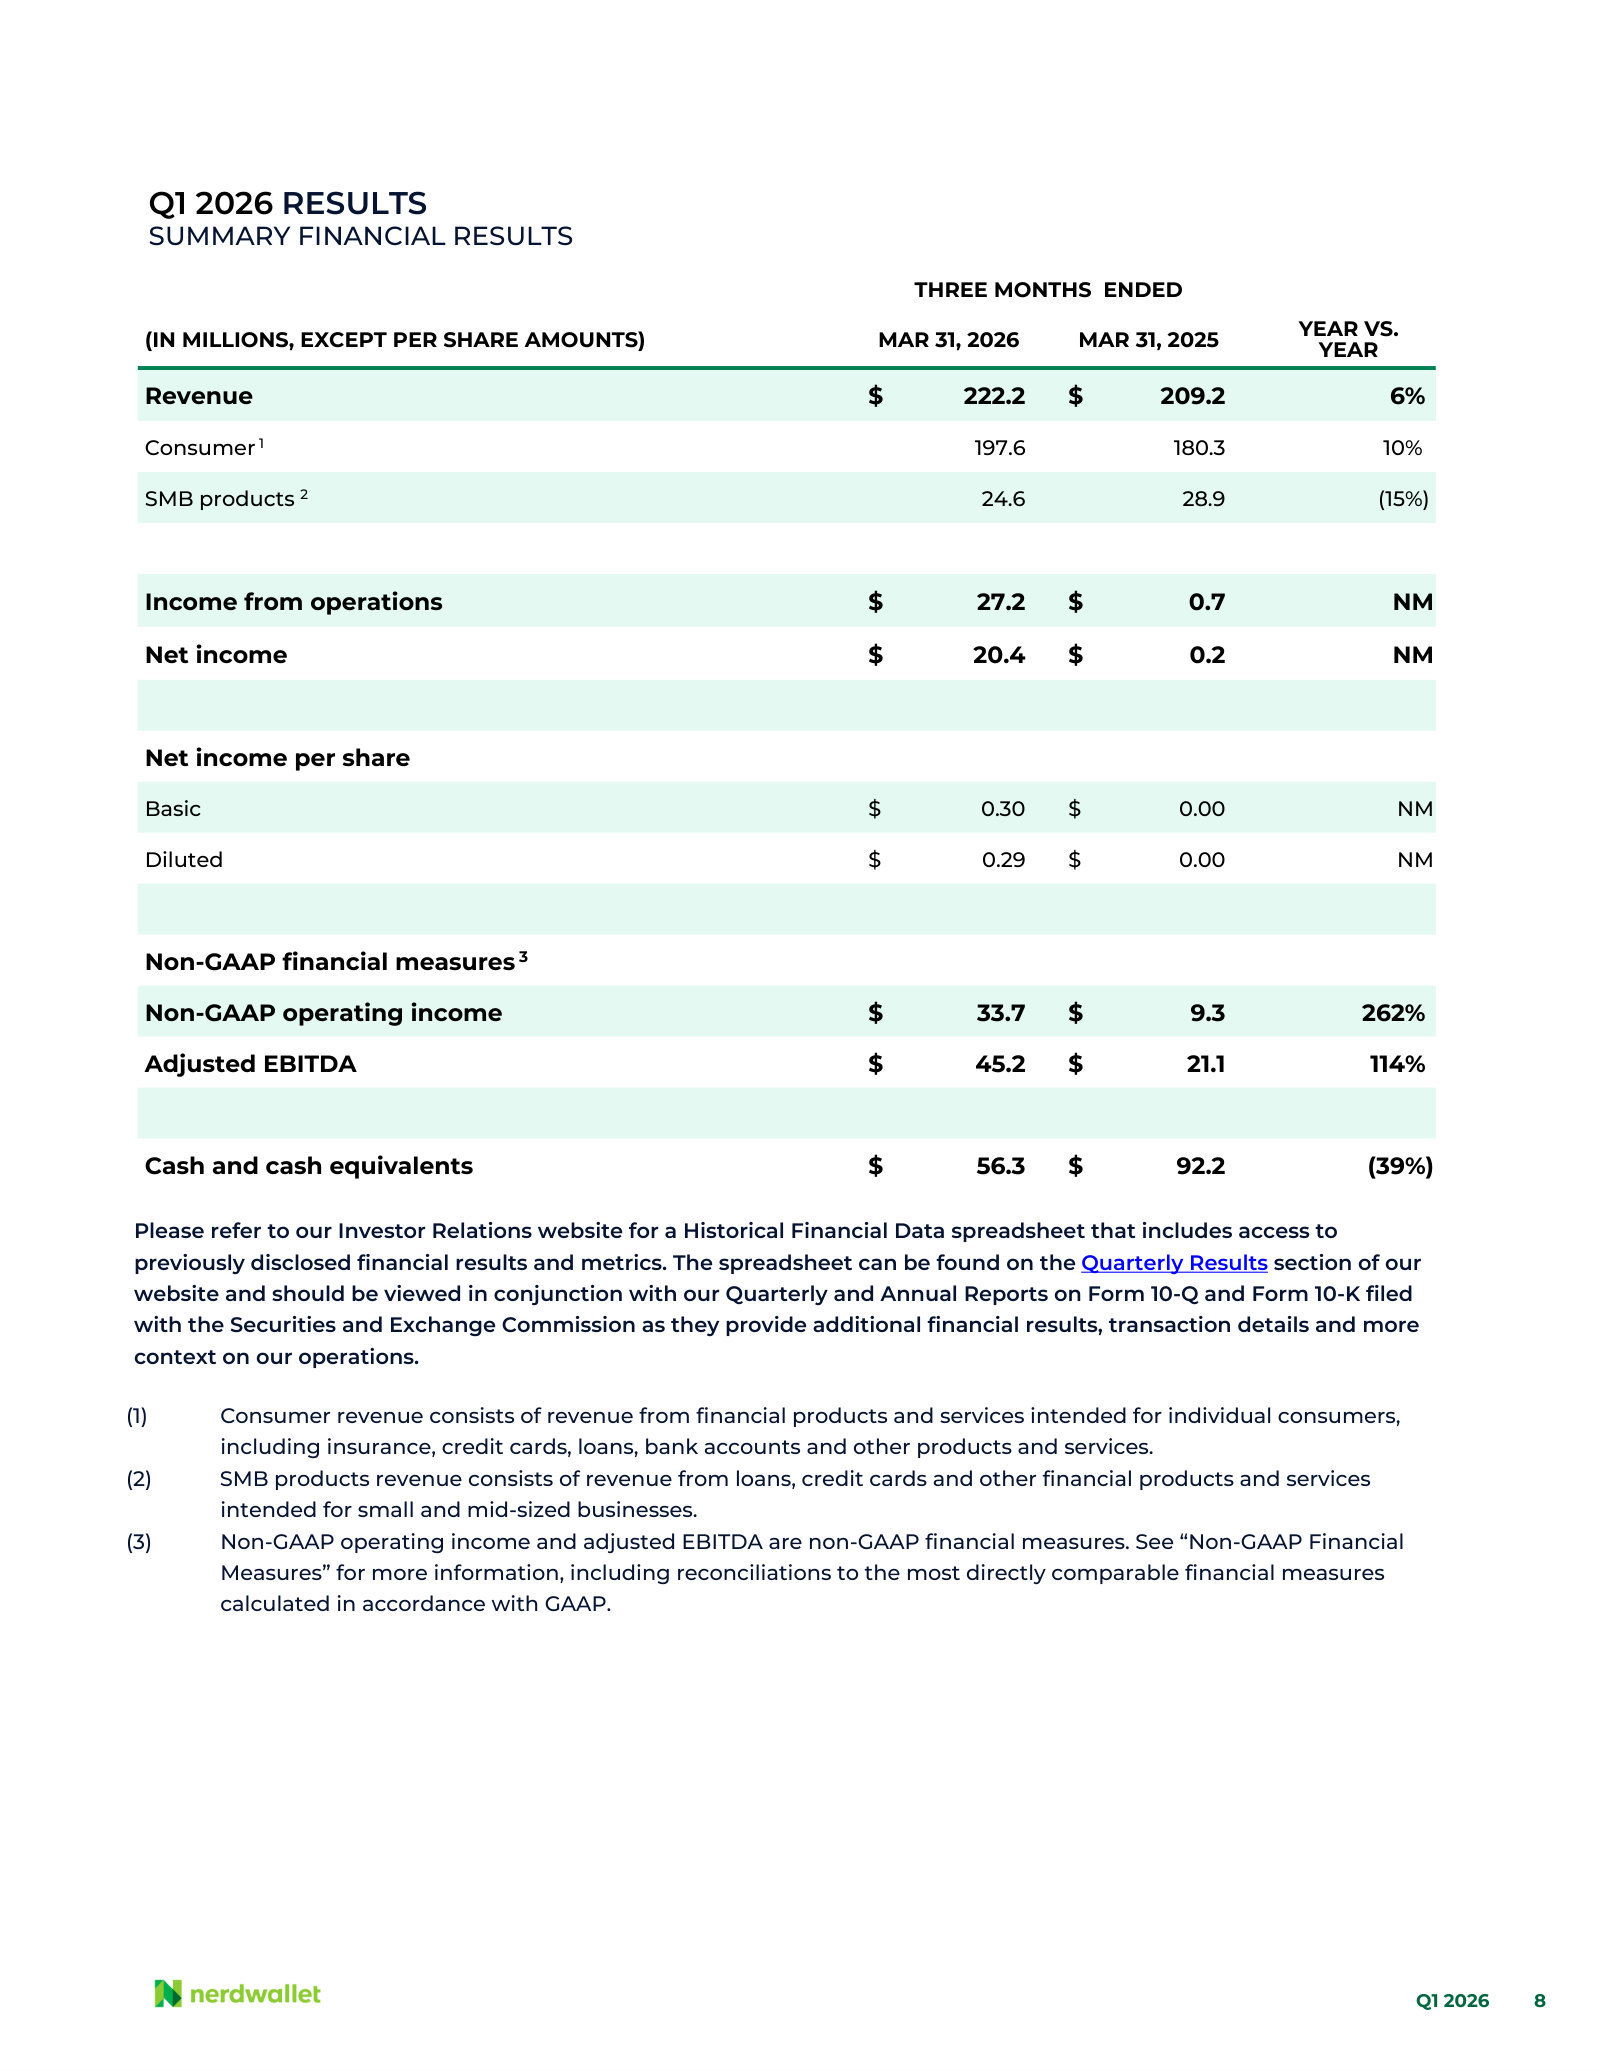
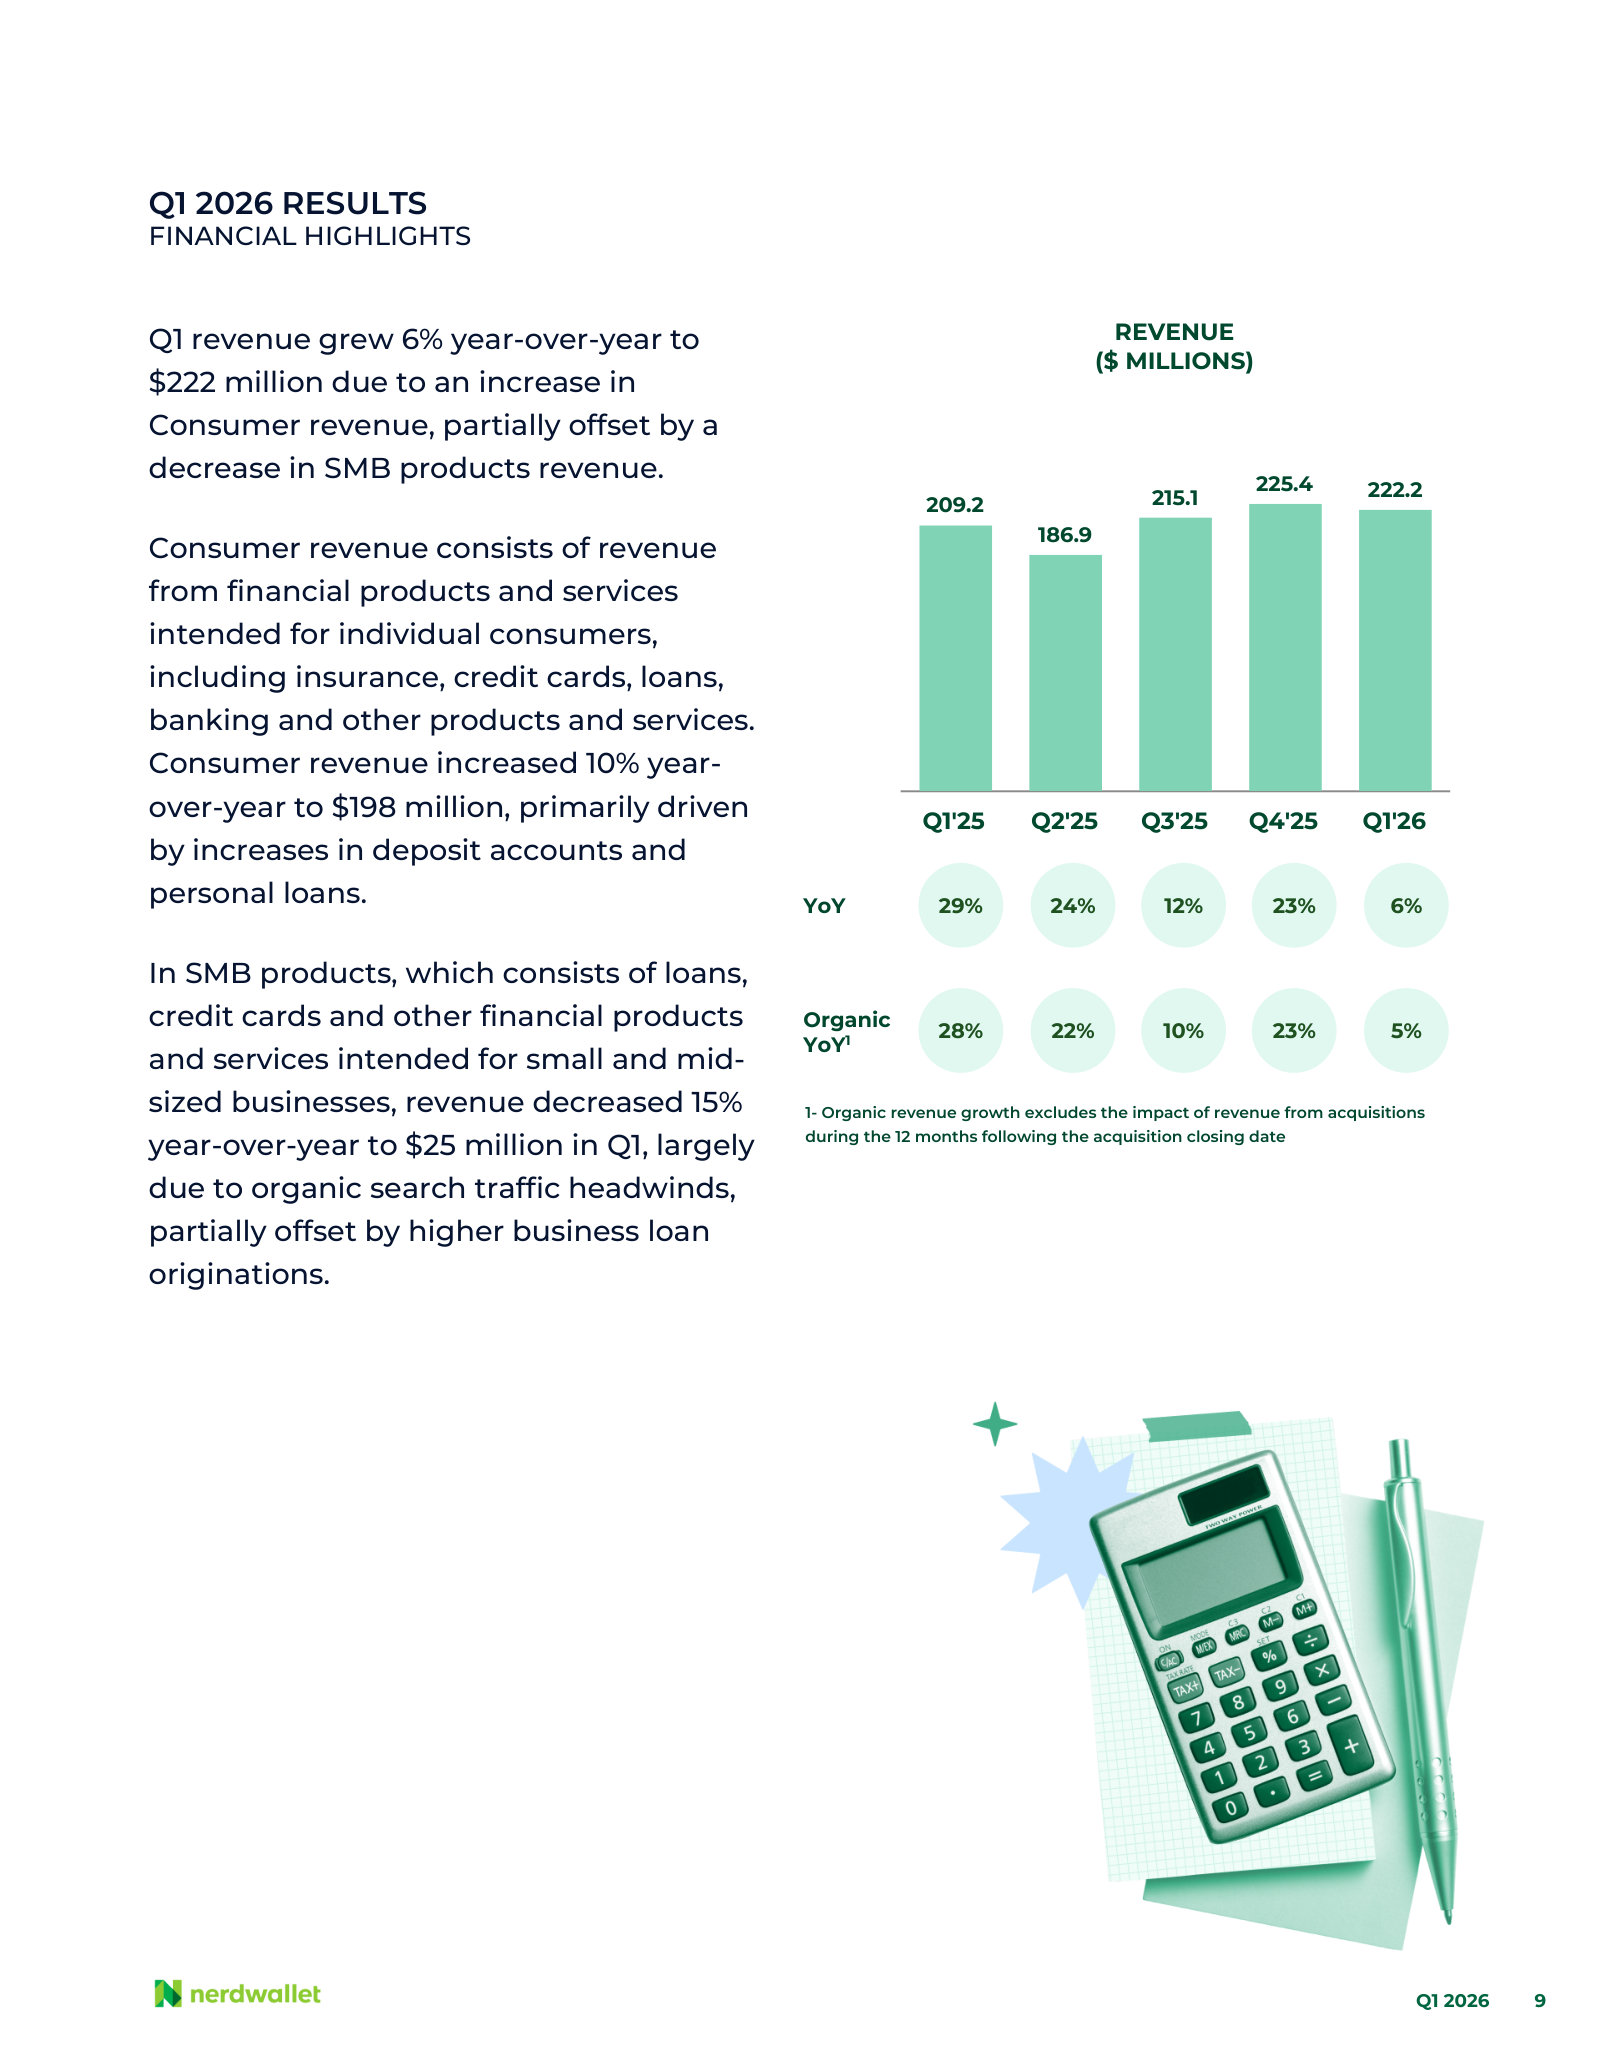
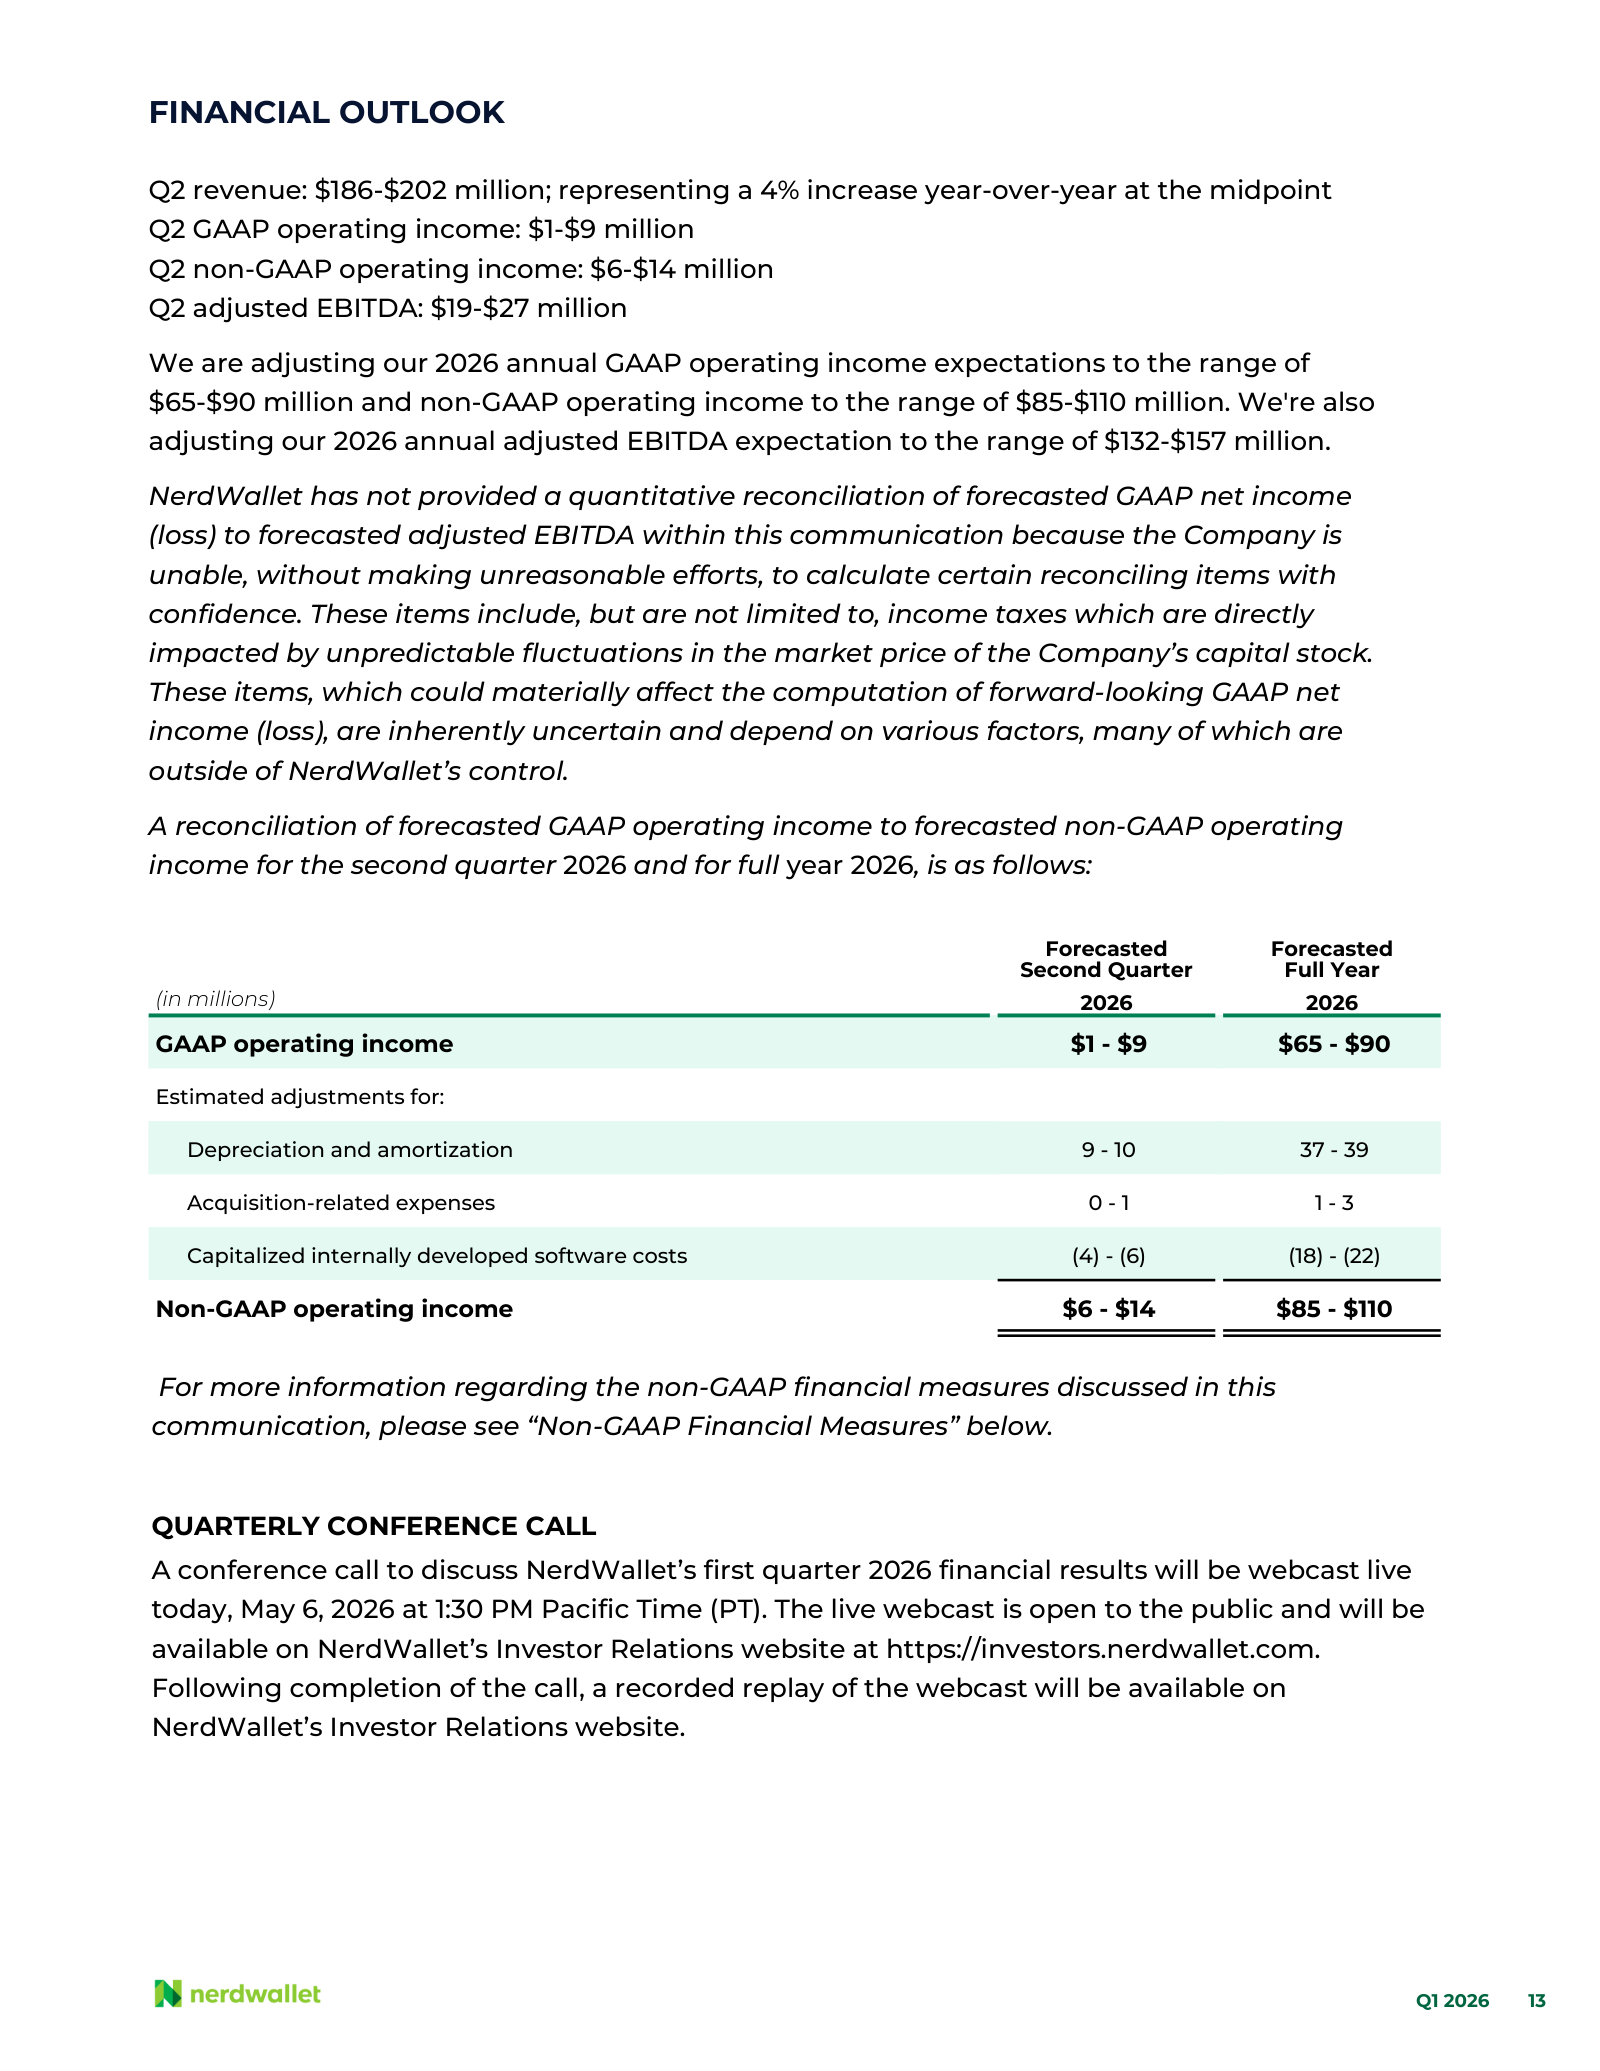
Q1 2026 Shareholder Letter — Q1 2026
The most recent results letter, and the first under the simplified Consumer / SMB reporting split; also states the current AI-era investment thesis. · Open the full document →
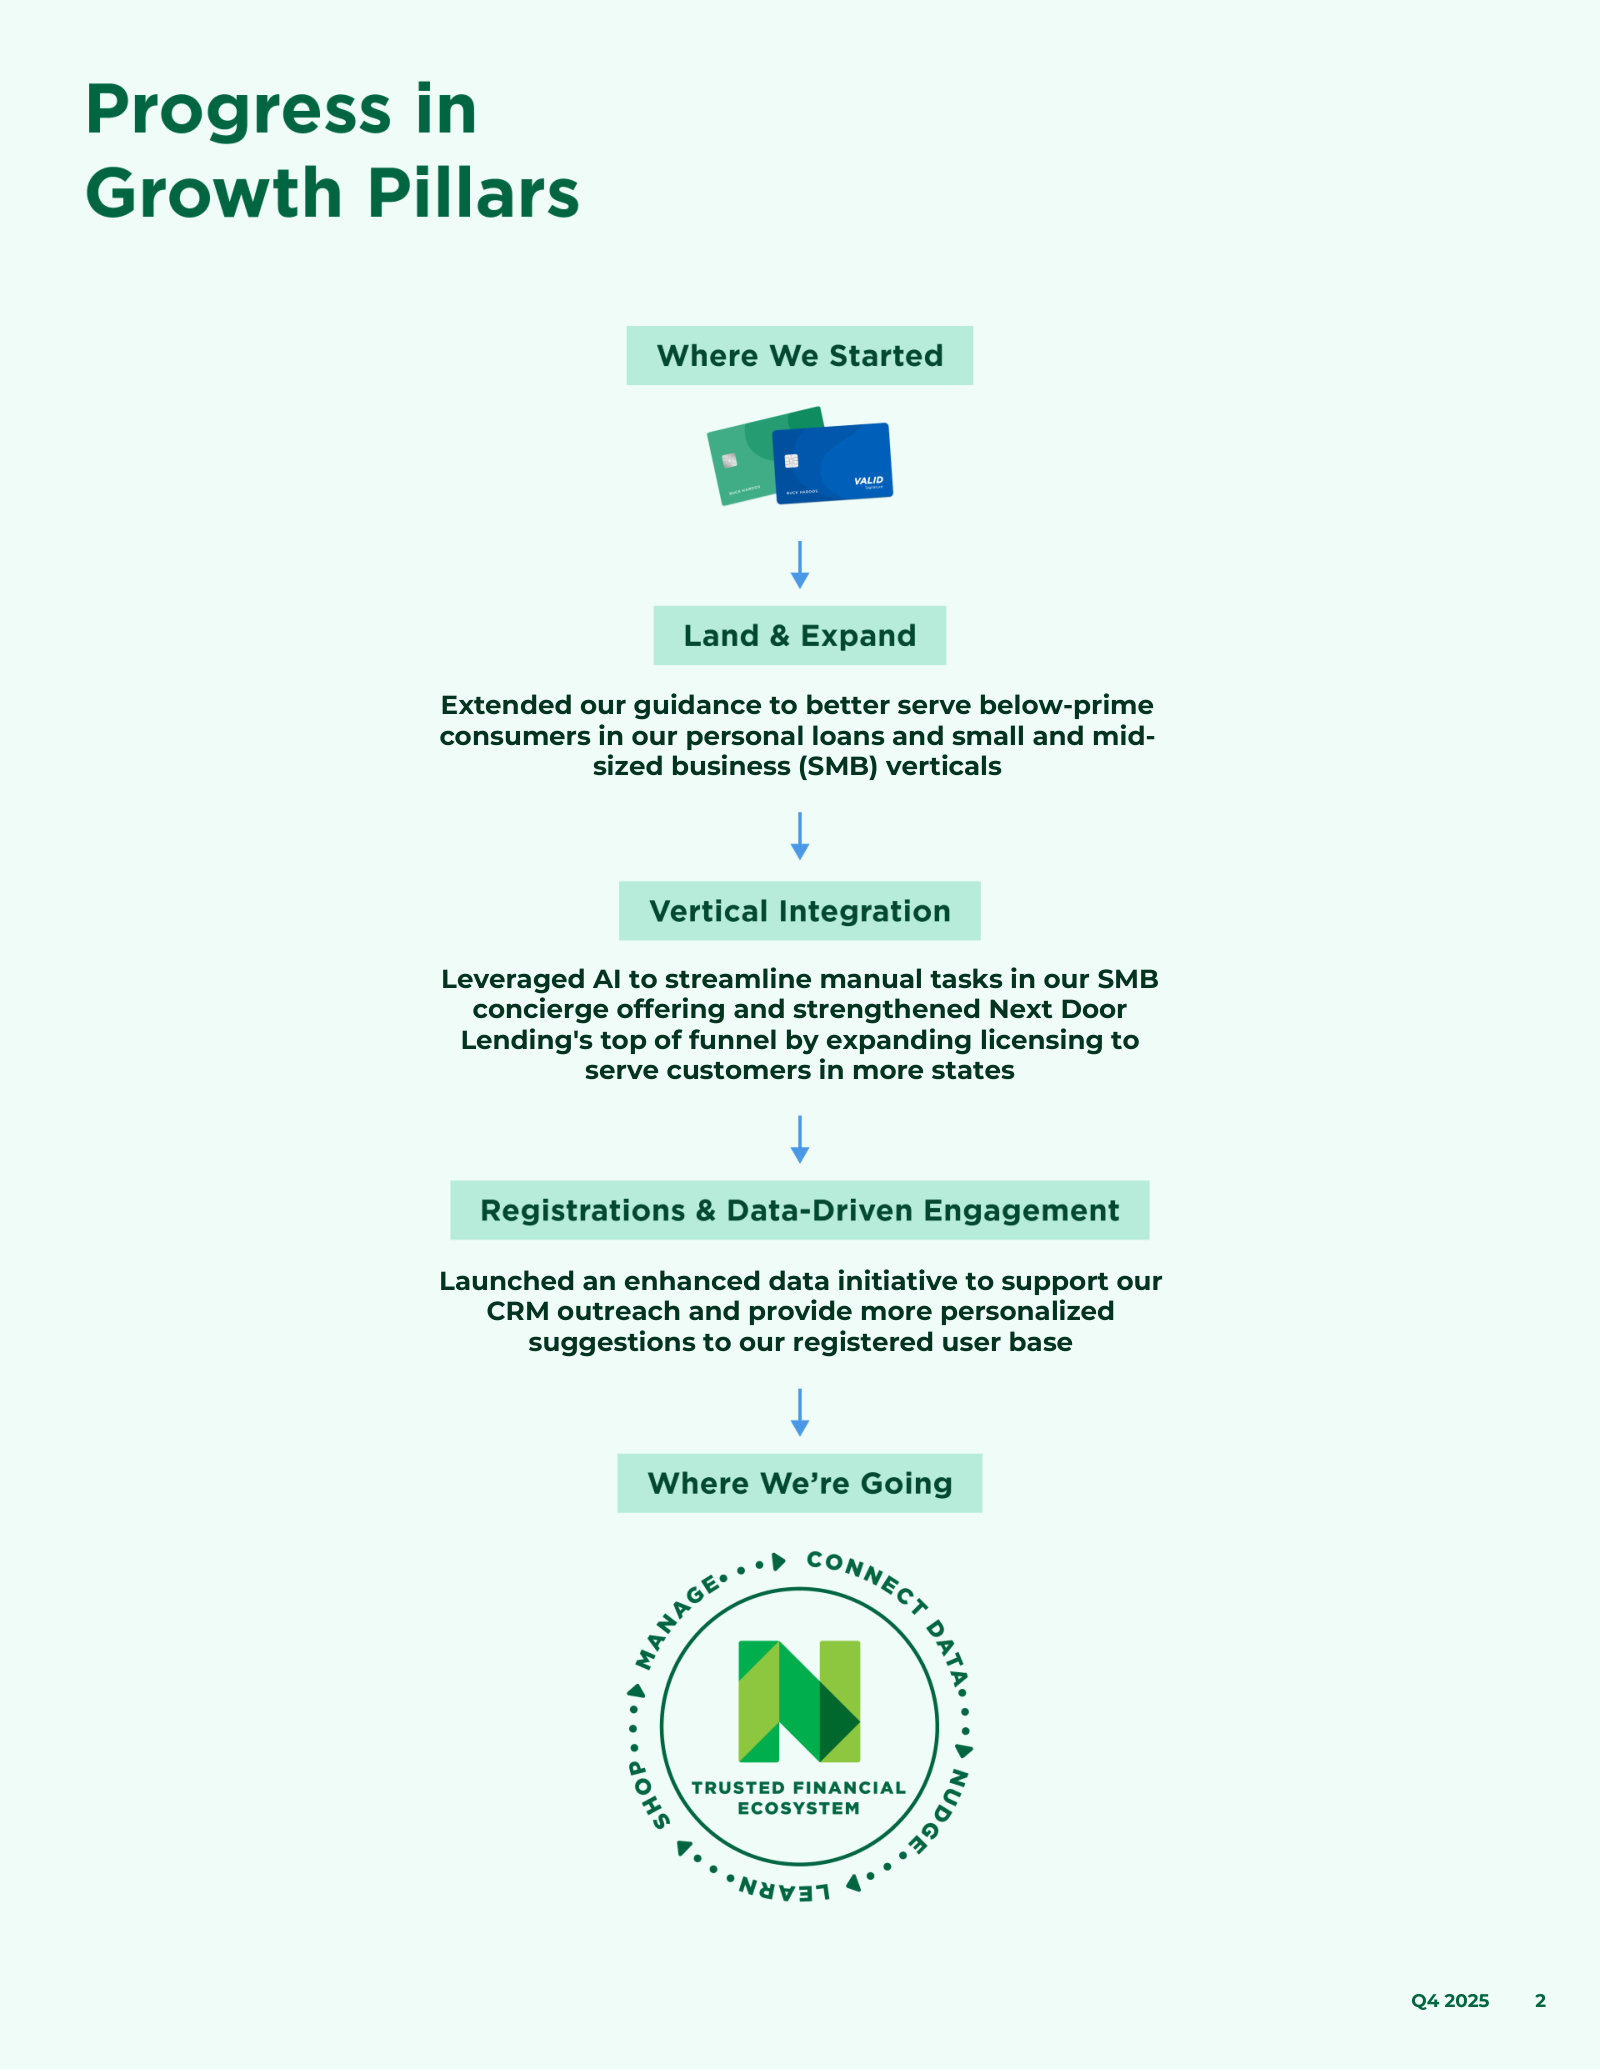
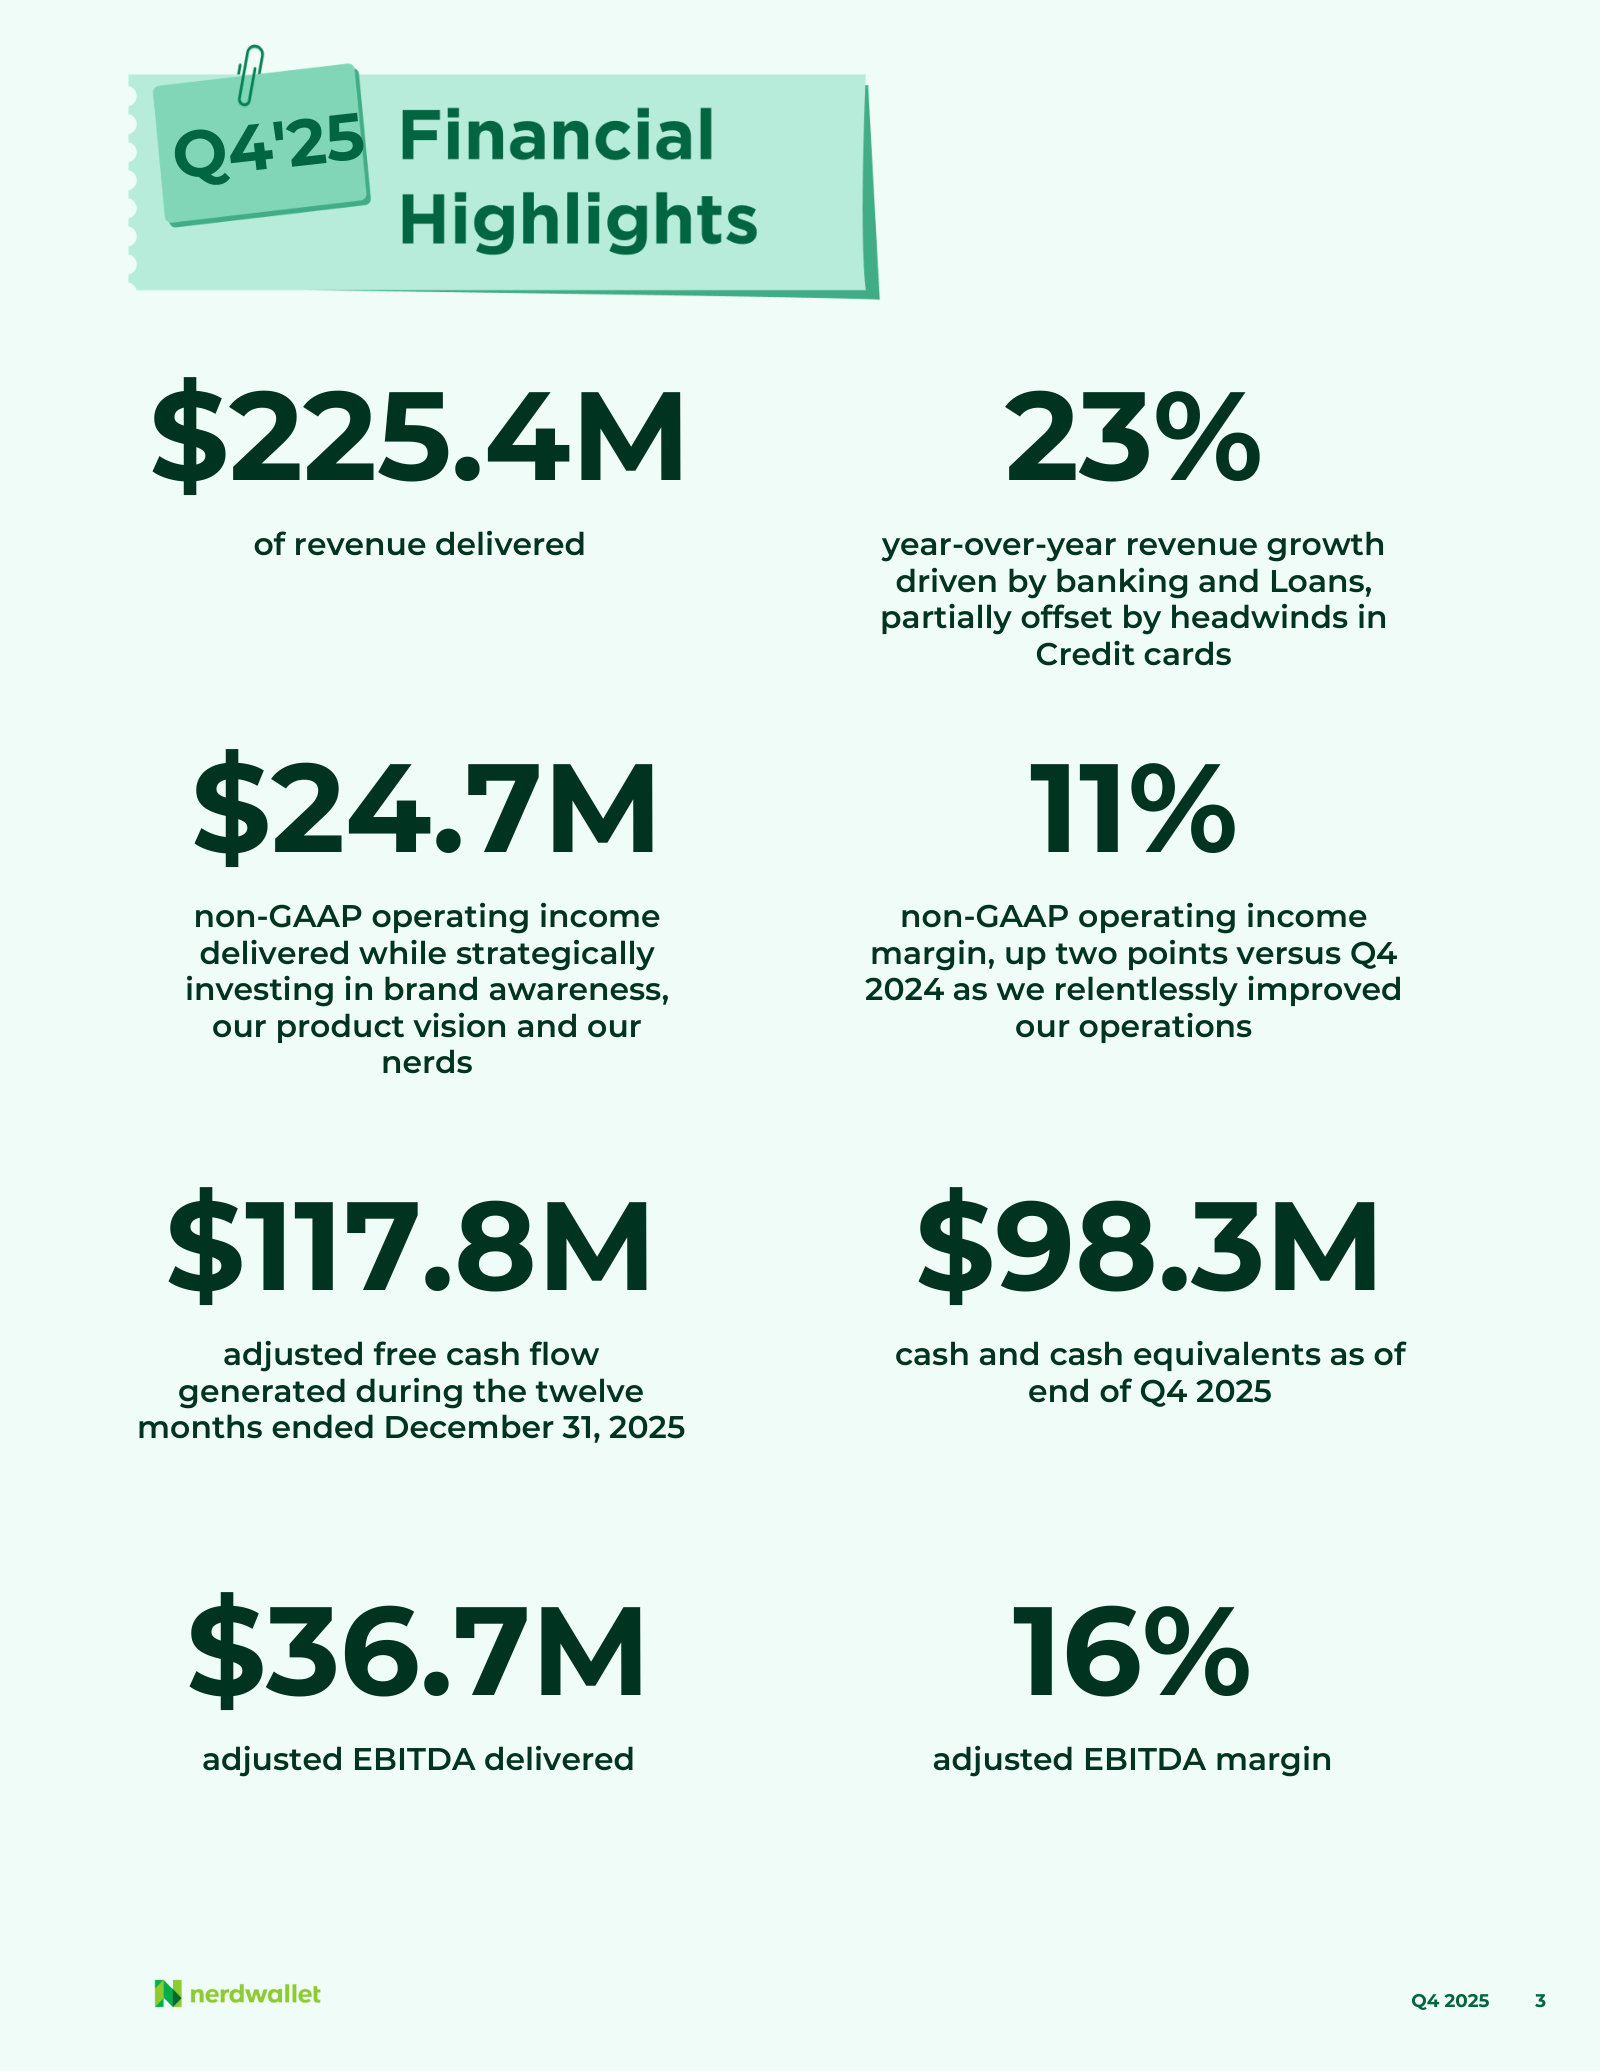
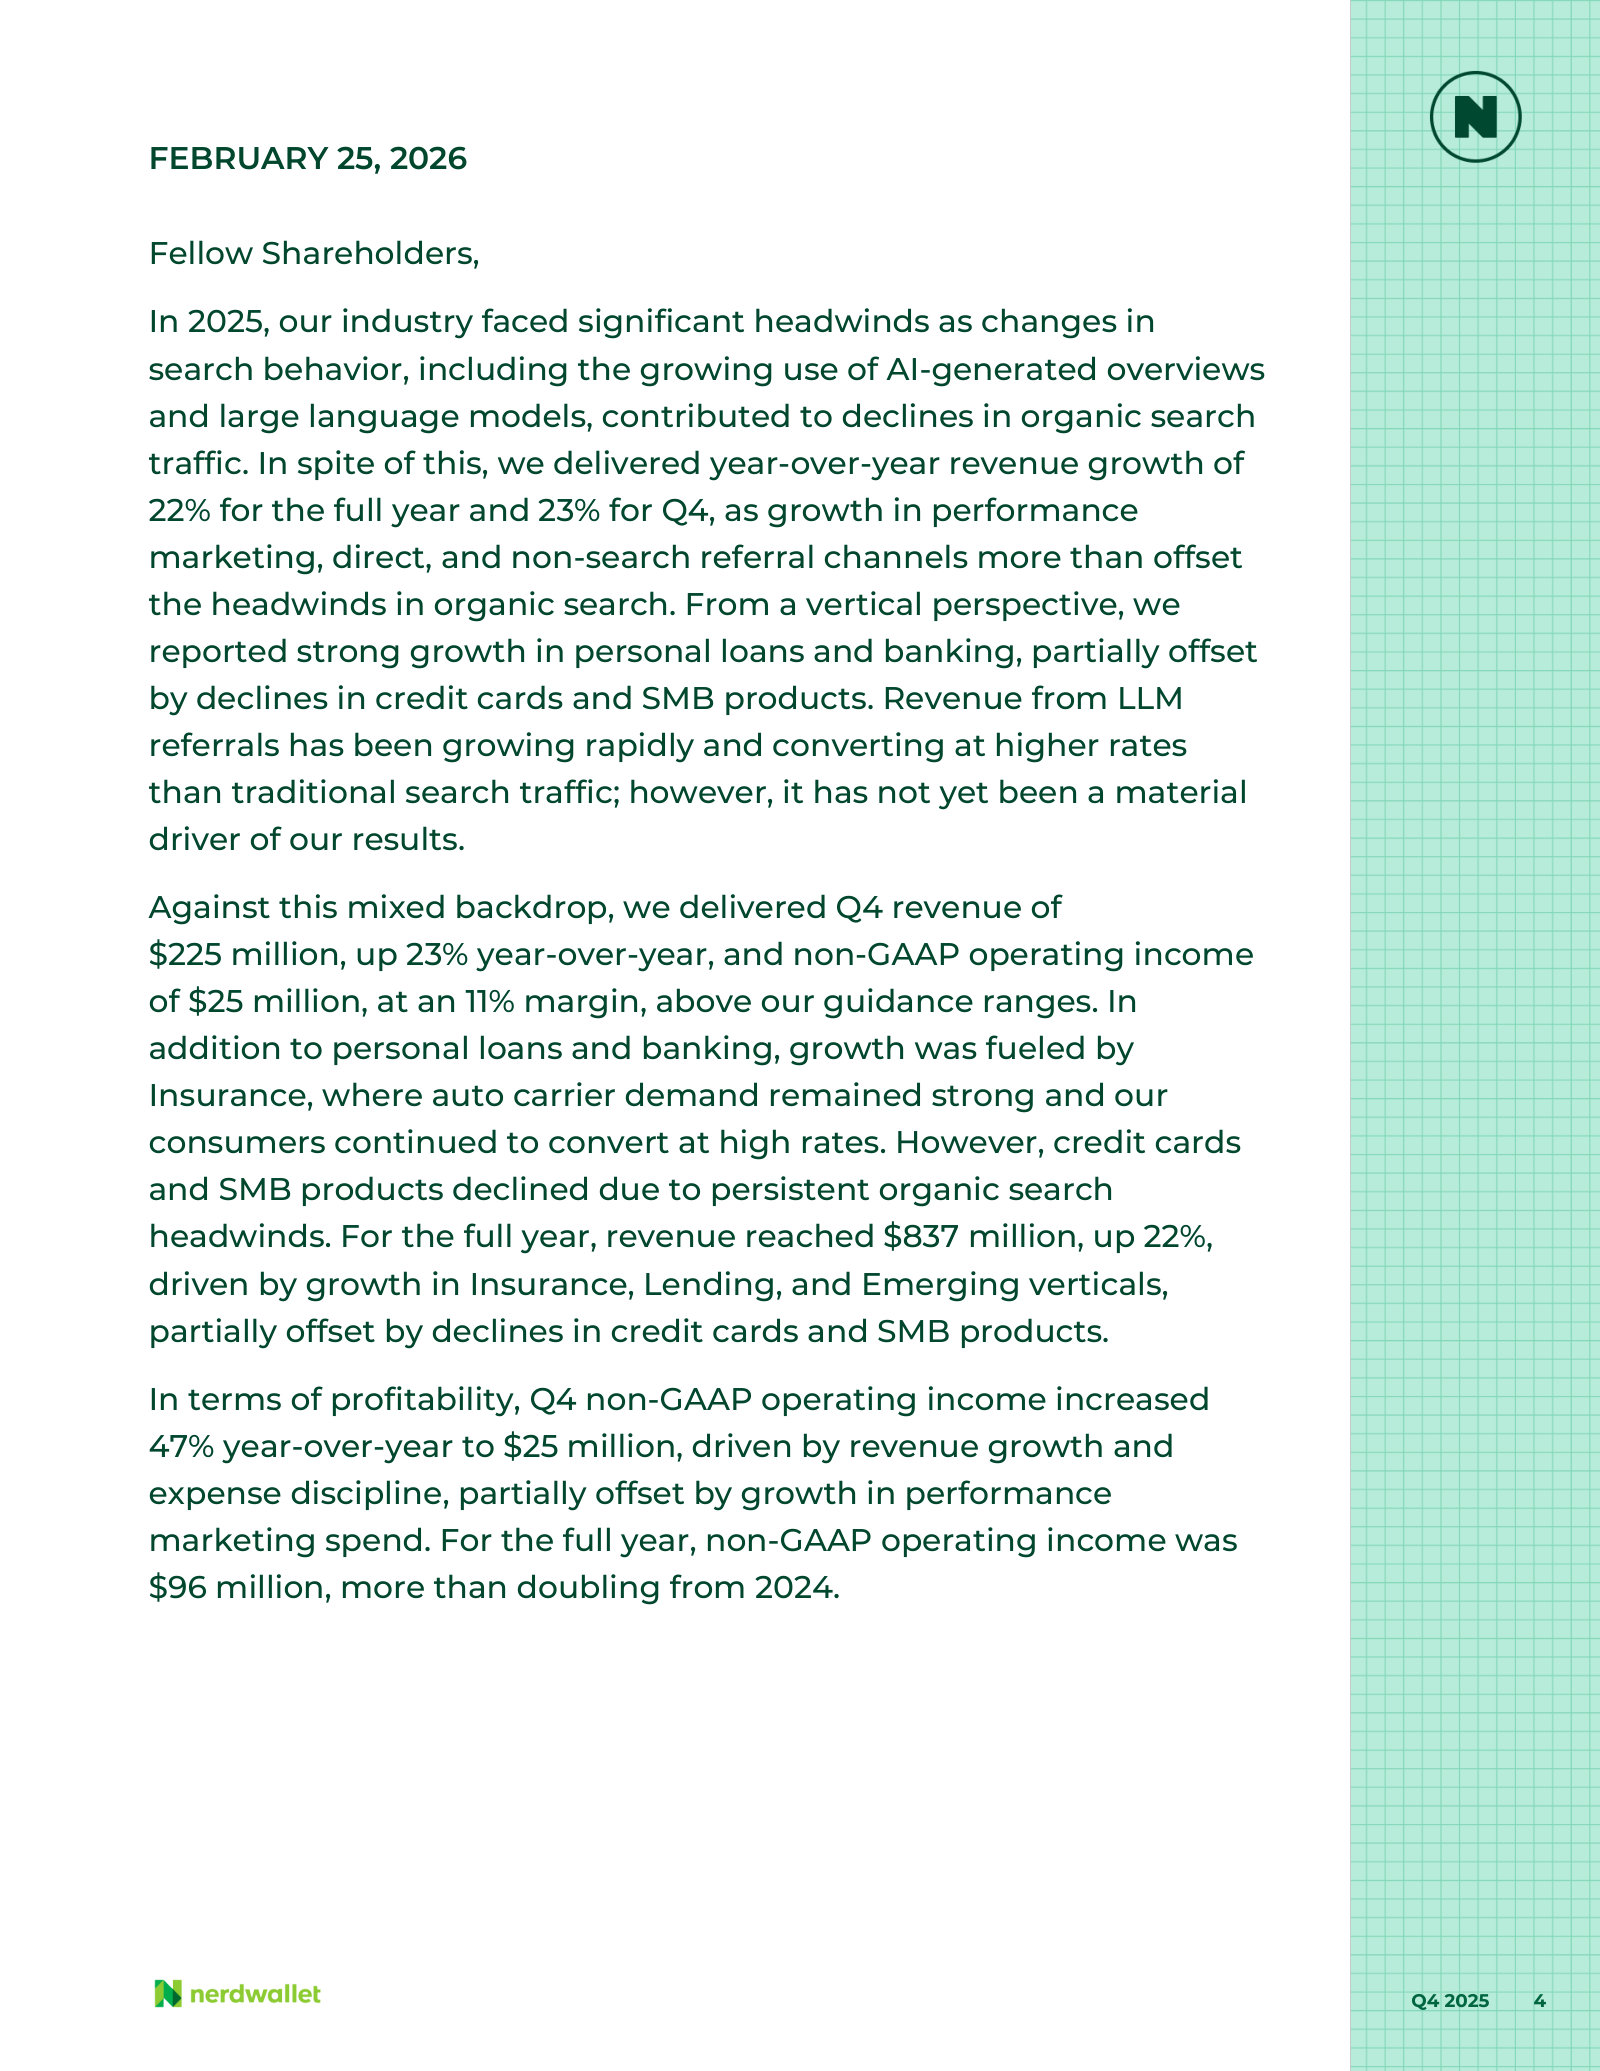
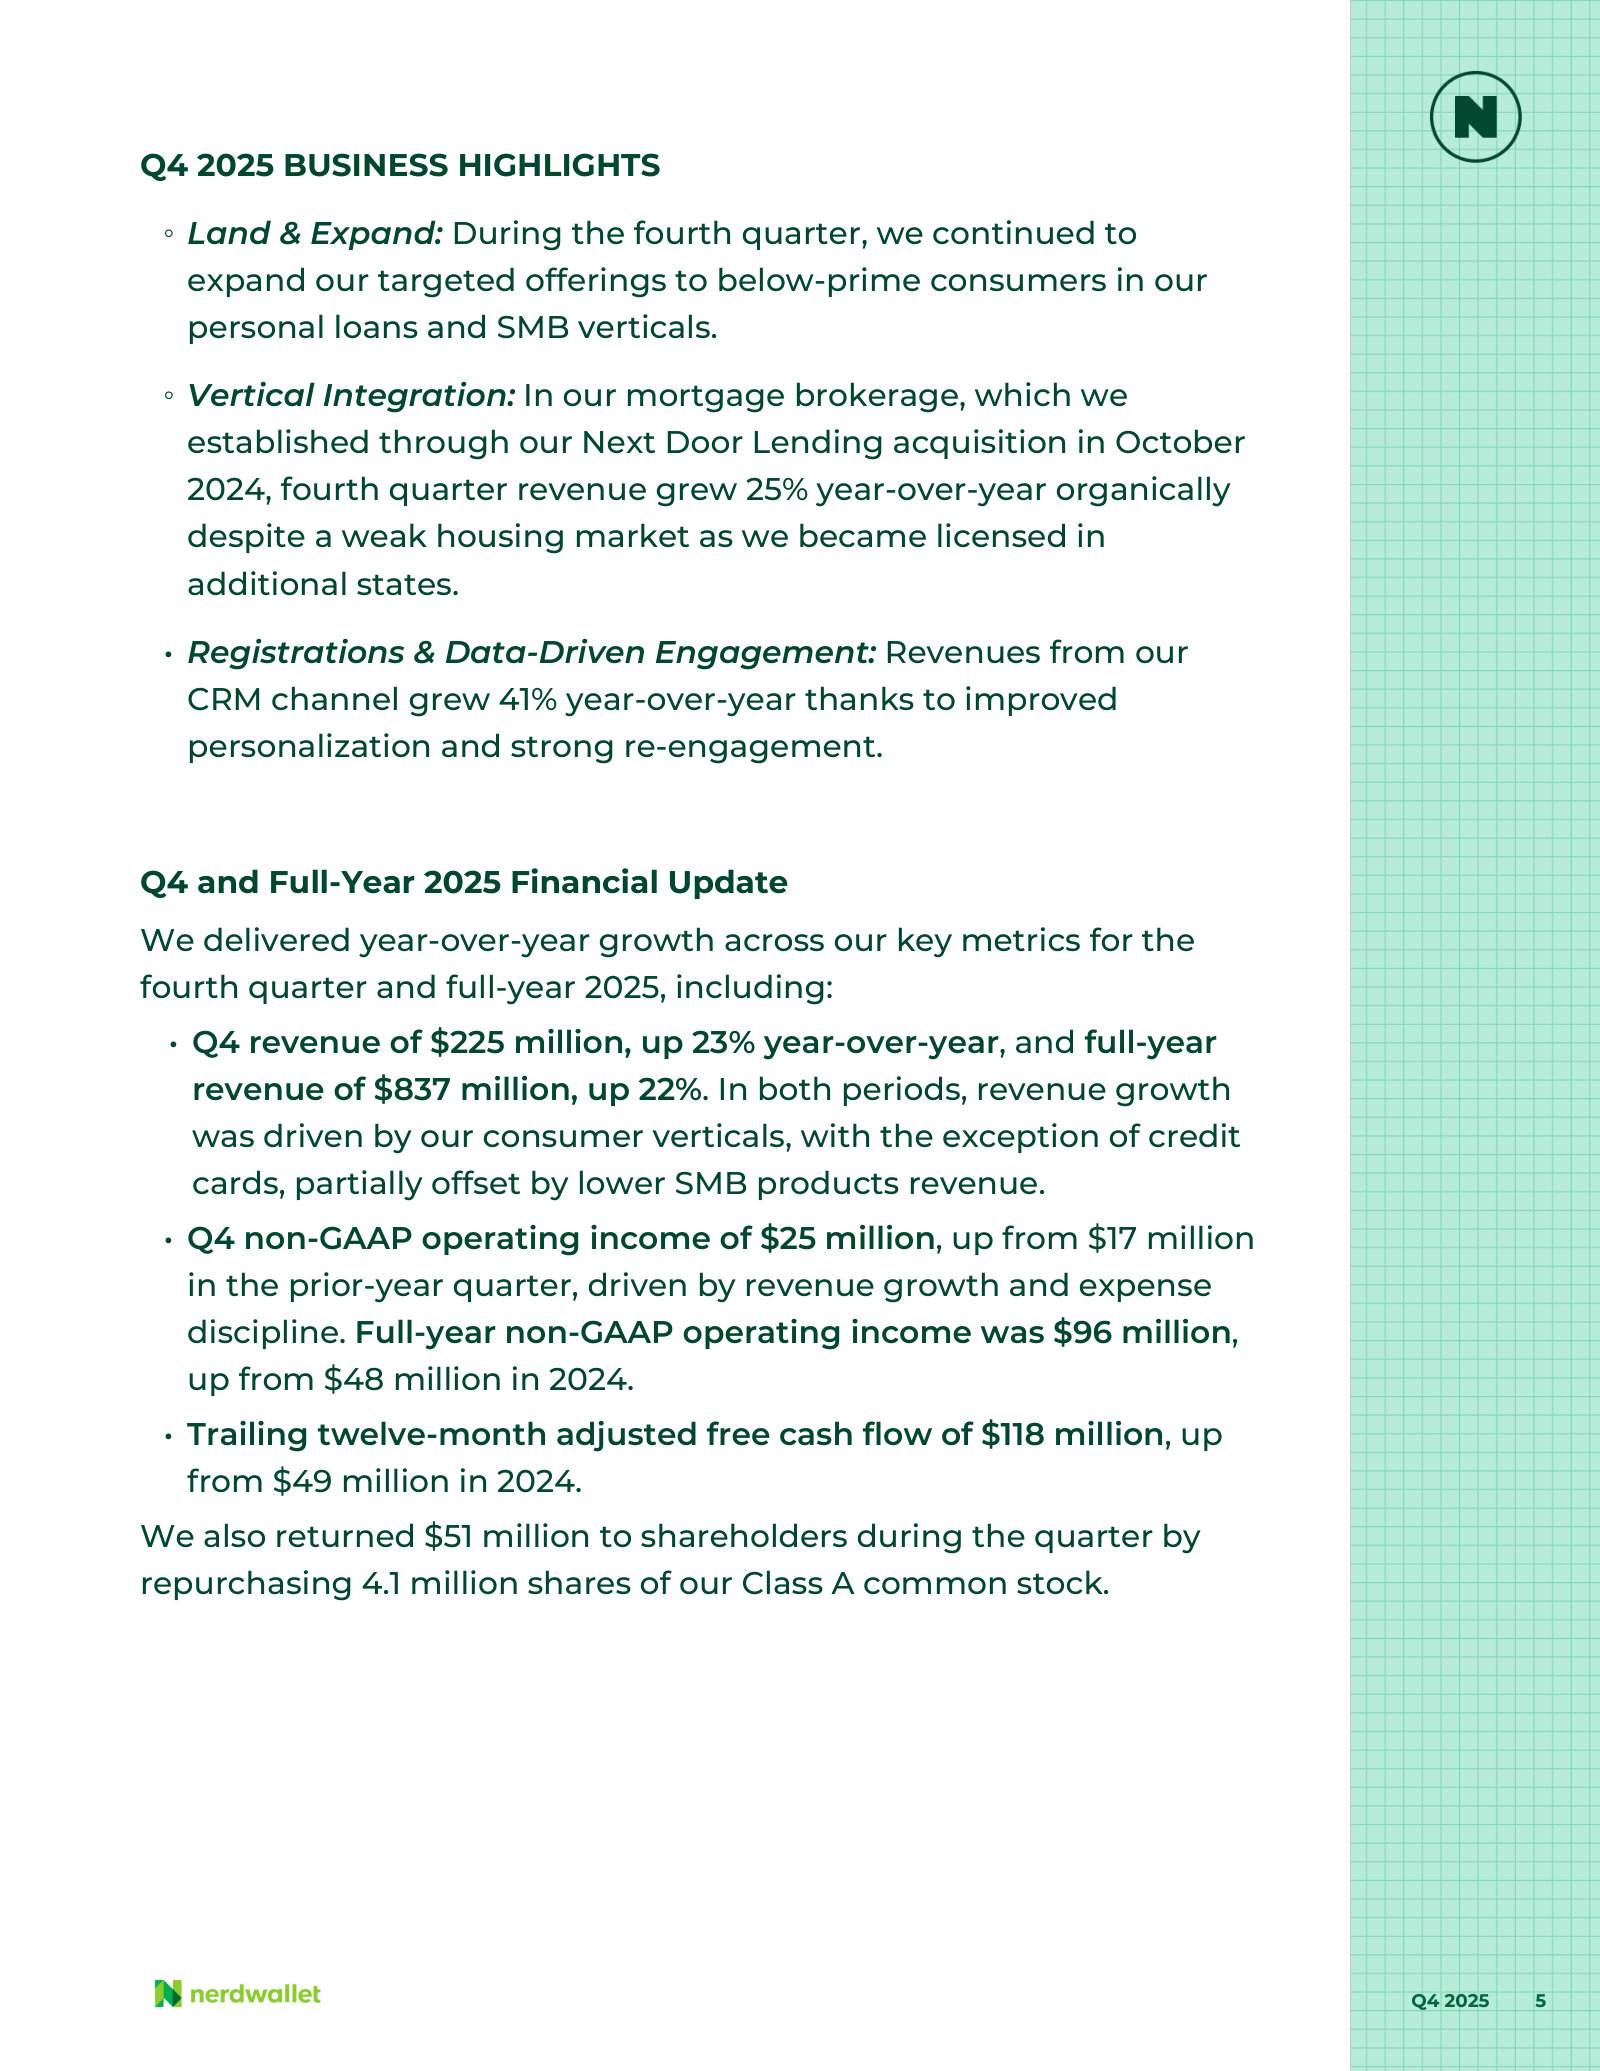
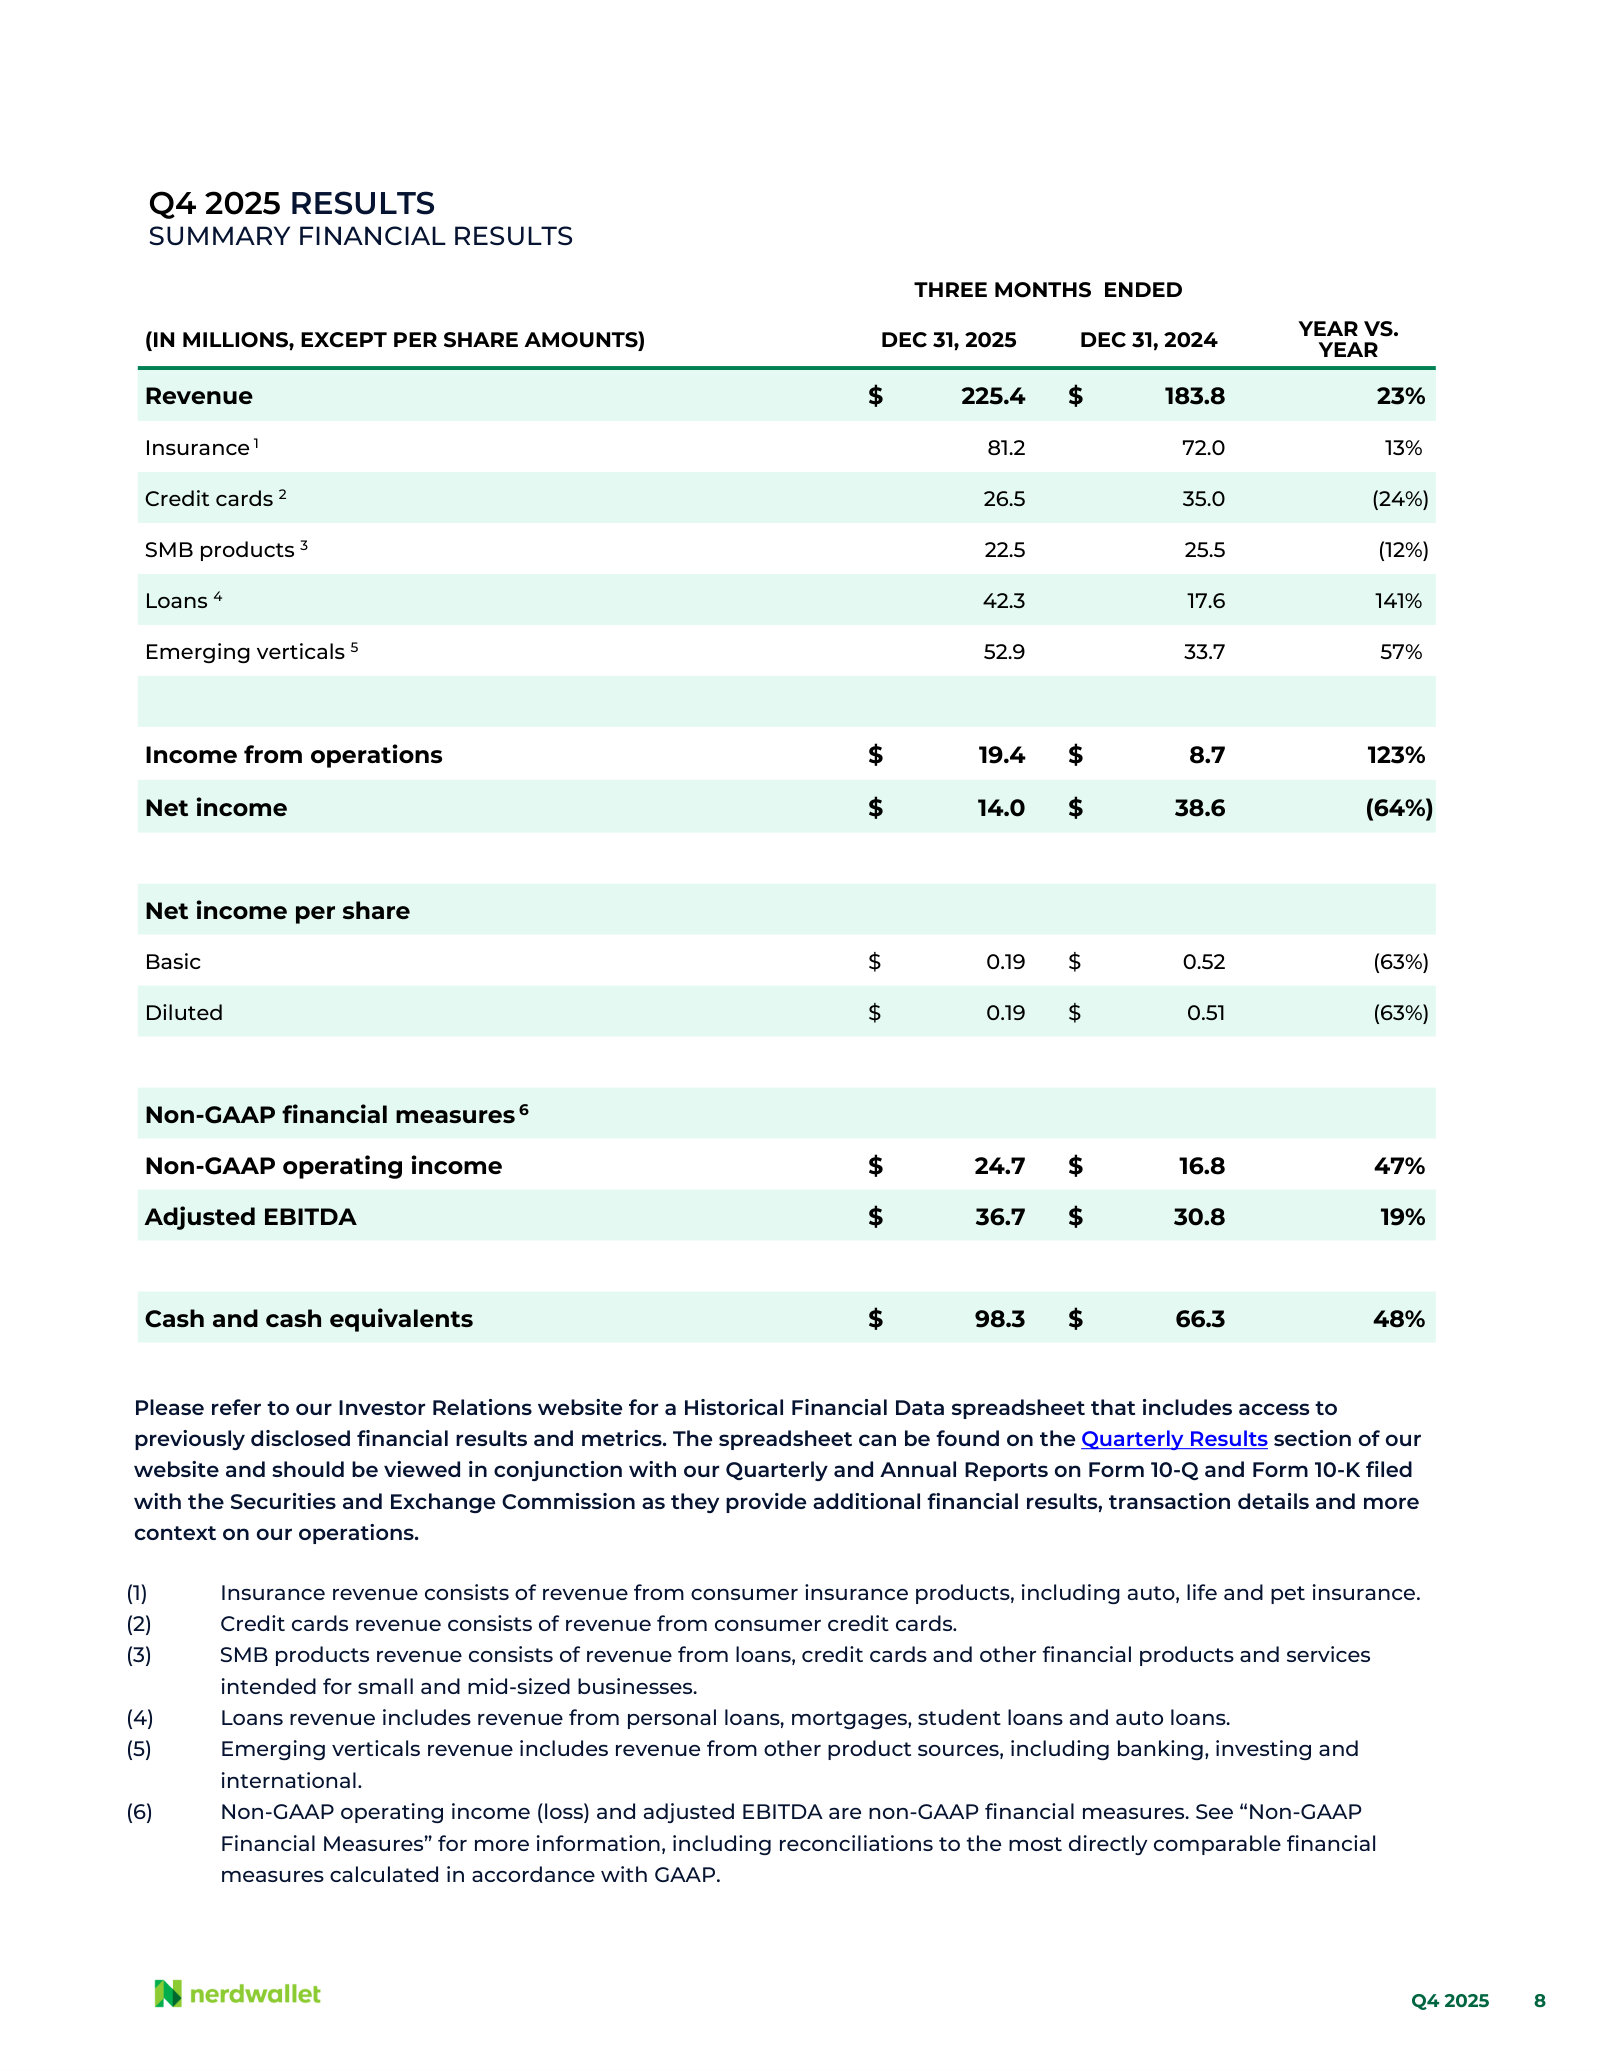
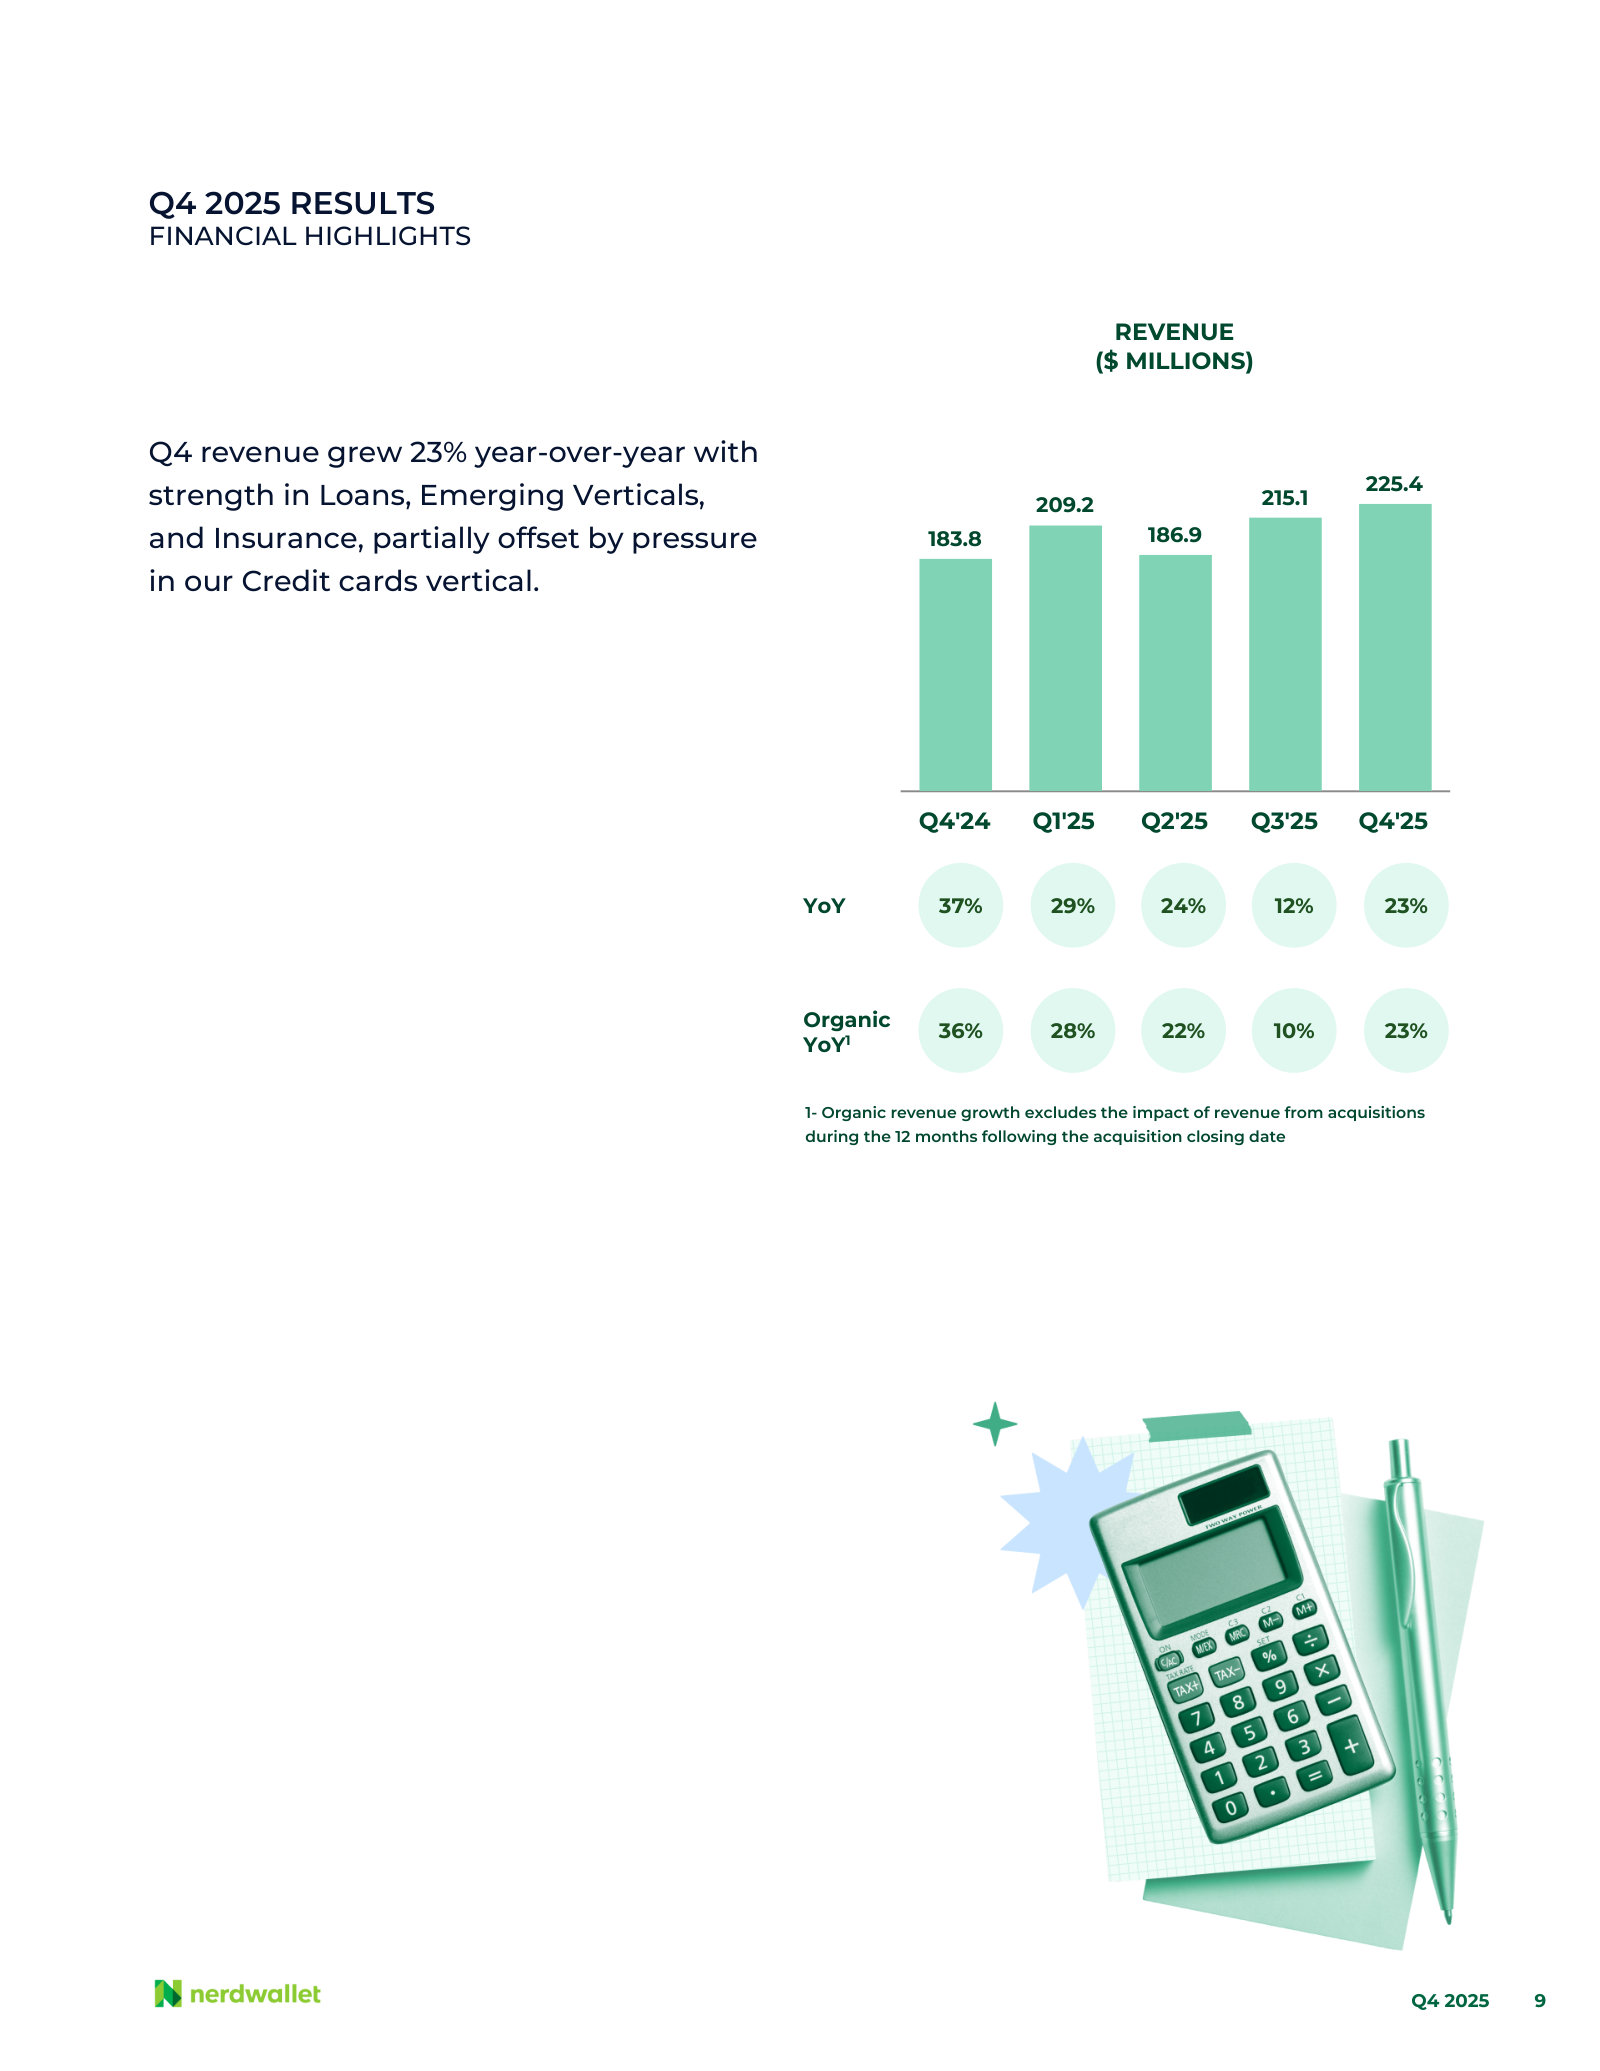
Q4 and Full-Year 2025 Shareholder Letter — Q4 / FY 2025
The full-year 2025 account, and the last letter to report revenue across all five verticals — the most granular view of where the money comes from. · Open the full document →
More from management
Q3 2025 Shareholder Letter — Q3 2025 · 23 pages · Growth slowed to 12% while margin reached 19%; management's fullest account of the below-prime push and the shift to paid traffic. · Open →
Q4 and Full-Year 2024 Shareholder Letter — Q4 / FY 2024 · 28 pages · Full-year 2024, the insurance surge, and the argument for dropping monthly unique users as a headline metric. · Open →
Q3 2024 Shareholder Letter — Q3 2024 · 26 pages · Where the Next Door Lending mortgage acquisition is explained, and the vertical-integration logic behind it. · Open →
Q4 and Full-Year 2023 Shareholder Letter — Q4 / FY 2023 · 26 pages · Full-year 2023 results and the 2024 guidance that the March 2024 investor deck is built on. · Open →
NerdWallet, Inc.'s management answers for the business every quarter. These are the exchanges that explain it best — verbatim, from the call transcripts preserved in Sources. Each link opens the full transcript at that page in a new tab.
Q1 2026 Earnings Call — Q1 2026
The current state of the thesis: one auto-insurance partner pulls back, and management answers why it is spending harder into vertical integration anyway. · Open the full transcript →
The two things that widened the guidance range: one insurance partner's monetization, and a deliberate step-up in long-term spending.
Tim Chen (Co-Founder & Chief Executive Officer): As we look ahead, we are affirming the high end of our full-year NGOI guidance range but taking a more conservative view on the lower end of the range to reflect two dynamics that are adding uncertainty to near-term results. First, in auto insurance, monetization from one of our large partners started running below our expectations, which impacted our Q1 results and is expected to have a greater impact in Q2. While this business can be volatile on a quarter-to-quarter basis, we are encouraged by the strong macro outlook for auto insurance customer acquisition spend. Against this healthy backdrop, we are deepening our technology integrations with several auto insurance carriers and expanding our offering with agent-centric carrier partners through phone-based referrals. We are also investing to build out our branded agency, NerdWallet, Inc. Insurance Experts. We believe that these investments will create a more diversified and resilient base from which we wil grow in the future. […] Second, we have decided to be more aggressive in placing our long-term bets. We believe our brand and distribution moats represent a growing advantage as less powerful brands struggle to reach consumers efficiently, while AI simultaneously reduces the cost of offering financial products. This is creating a unique investment window for NerdWallet, Inc. While this environment is increasingly challenging for newer entrants and single-product companies, our trusted brand leaves us in a strong position to capitalize o our massive consumer reach and distribution network. Whether we are evaluating corp dev opportunities or building offerings like NerdWallet, Inc. Insurance Experts, we believe we are in a sweet spot to generate attractive long-term returns on these investments.
p. 1 · Read in context →
Why NerdWallet is buying and building products: product cost is falling, distribution cost is rising.
Miles Jakubiak (KeyBanc Capital Markets); Tim Chen (Co-Founder & Chief Executive Officer): Great. Thank you. This is Miles Jakubiak on for Justin. I wanted to dive deeper on the acceleration of investments in the vertical integration. Could you give more context around what you saw or what changed that led you to want to push the pedal on more investment in these areas? And then any more context you can provide around where these dollars are goin within the vertical integration strategy would be helpful. Thank you. […] Thanks for the question, Miles. High level, the cost of launching financial products is decreasing rapidly, as everything from software to call centers to capital markets is getting more efficient. Meanwhile, the cost of distribution is going up. That means now more than ever, distribution is king. As a result, a lot of bright entrepreneurs, whether internal to NerdWallet, Inc. or external, are seeing NerdWallet, Inc. as a great place to build. So we have a really unique investment window. From the corp dev side, we are seeing a lot of people coming to us who value our distribution and who have built great products. We are also considering building a lot of things ourselves as well.
p. 3 · Read in context →
Guidance philosophy made explicit: exactly what the high and low ends of the full-year range each assume.
Michael Aravante (Morgan Stanley); John Lee (Chief Financial Officer): Hey, two questions for me. I will ask them both at the same time. Are you able to parse how much of the full-year low-end NGOI reduction is driven by the monetization dynamics versus the incremental investments? And then, Tim, on the incremental investment—you obviously gave some commentary there—we are in the middle of a significant structural profitability change in the business with the mix shift towards performance marketing. Can you walk us through the work that you have done internally to get comfortable with the returns that you intend to deliver here? Thank you. […] Thank you for the question. On the full-year NGOI guidance, we are reaffirming the upper end of our previously issued guidance range with the expectation that we will continue to grow revenue year over year in each of the remaining quarters. In terms of the low end of the range, we assume that we are not able to offset the insurance weakness for the entire year and we continue to invest further into our vertical integration strategy, whereas the high end of the range represents that we are able to offset the insurance weakness in the second half of the year while identifying fewer investment opportunities in our vertical integration strategy.
p. 3 · Read in context →
The hardest answer of the call: carrier concentration named, and the hurdle rate that vertical integration has to clear.
Tim Chen (Co-Founder & Chief Executive Officer): I will take the second part of that, and I will give a little more color on insurance as well. One of our large carriers pulled back in March, and we have a lot of concentration towards a few carriers currently and a few channels. Taking a step back, even after growing our insurance business several fold over the past few years, we are still a relatively new player in this market and have a pretty high concentration. We are investing in growing additional carriers, and we are also starting to sell directly to agents. That is a new business for us. That rounds out our core click offerings with calls and leads, and it enables us to open up additional channels. In terms of the IRR analysis, we obviously want to exceed our cost of capital when we are doing things like vertical integration—and our cost of capital is pretty high. If you look at our free cash flow yield versus our market cap and our growth rate, that is a pretty high hurdle to get over. What is unique for us is we have that big top of funnel. When we are looking at things from a corp dev perspective, we can do commercial testing with partners and get a pretty good sense of how that is going to shake out. When we are building internally, with all the new tools and infrastructure that are available now, you can do incredible stuff with pretty small teams. Both of those are affecting the cost side of the IRR calculation.
p. 3 · Read in context →
How long the insurance rebuild takes, and how small LLM referral traffic still is despite high conversion.
Ralph Schackart (William Blair); Tim Chen (Co-Founder & Chief Executive Officer): Maybe piggybacking off that last question on insurance, can you give us a better understanding of the investment needed in terms of the dollars and the duration of this investment? Is this going to be a multi-quarter cycle, or something that you think could b quickly built to add that additional carrier capacity? And then maybe just an update on th LLM traffic—what you have observed or learned since the last call. Any sense how cannibalistic this is or how that traffic is shaking out? Thank you. […] On the insurance buildout, we are definitely talking multi-quarters. We are standing up a system where we are routing calls to agents—both independent agents as well as captive agents. That takes time. We have to build that out from both an operational side as well as a business development side, demonstrate our value, and follow the playbook over time. I would expect more of a slower ramp there. We are going to try to do it efficiently, but that is an incremental investment. In terms of LLM traffic, it is pretty much the same story as last quarter. We are dominant when it comes to LLM share in financial services or money questions based on the third-party data we have seen. We do see people coming through, and we see high conversion rates. It is just a very small piece of our overall pie right now from a revenue perspective.
p. 4 · Read in context →
Q4 and Full Year 2025 Earnings Call — Q4 FY2025
The full-year framing of the AI transition — where revenue actually came from, and why management thinks agents cannot easily route around a licensed marketplace. · Open the full transcript →
The revenue engine vertical by vertical: lending and banking carrying growth while search-dependent categories shrink.
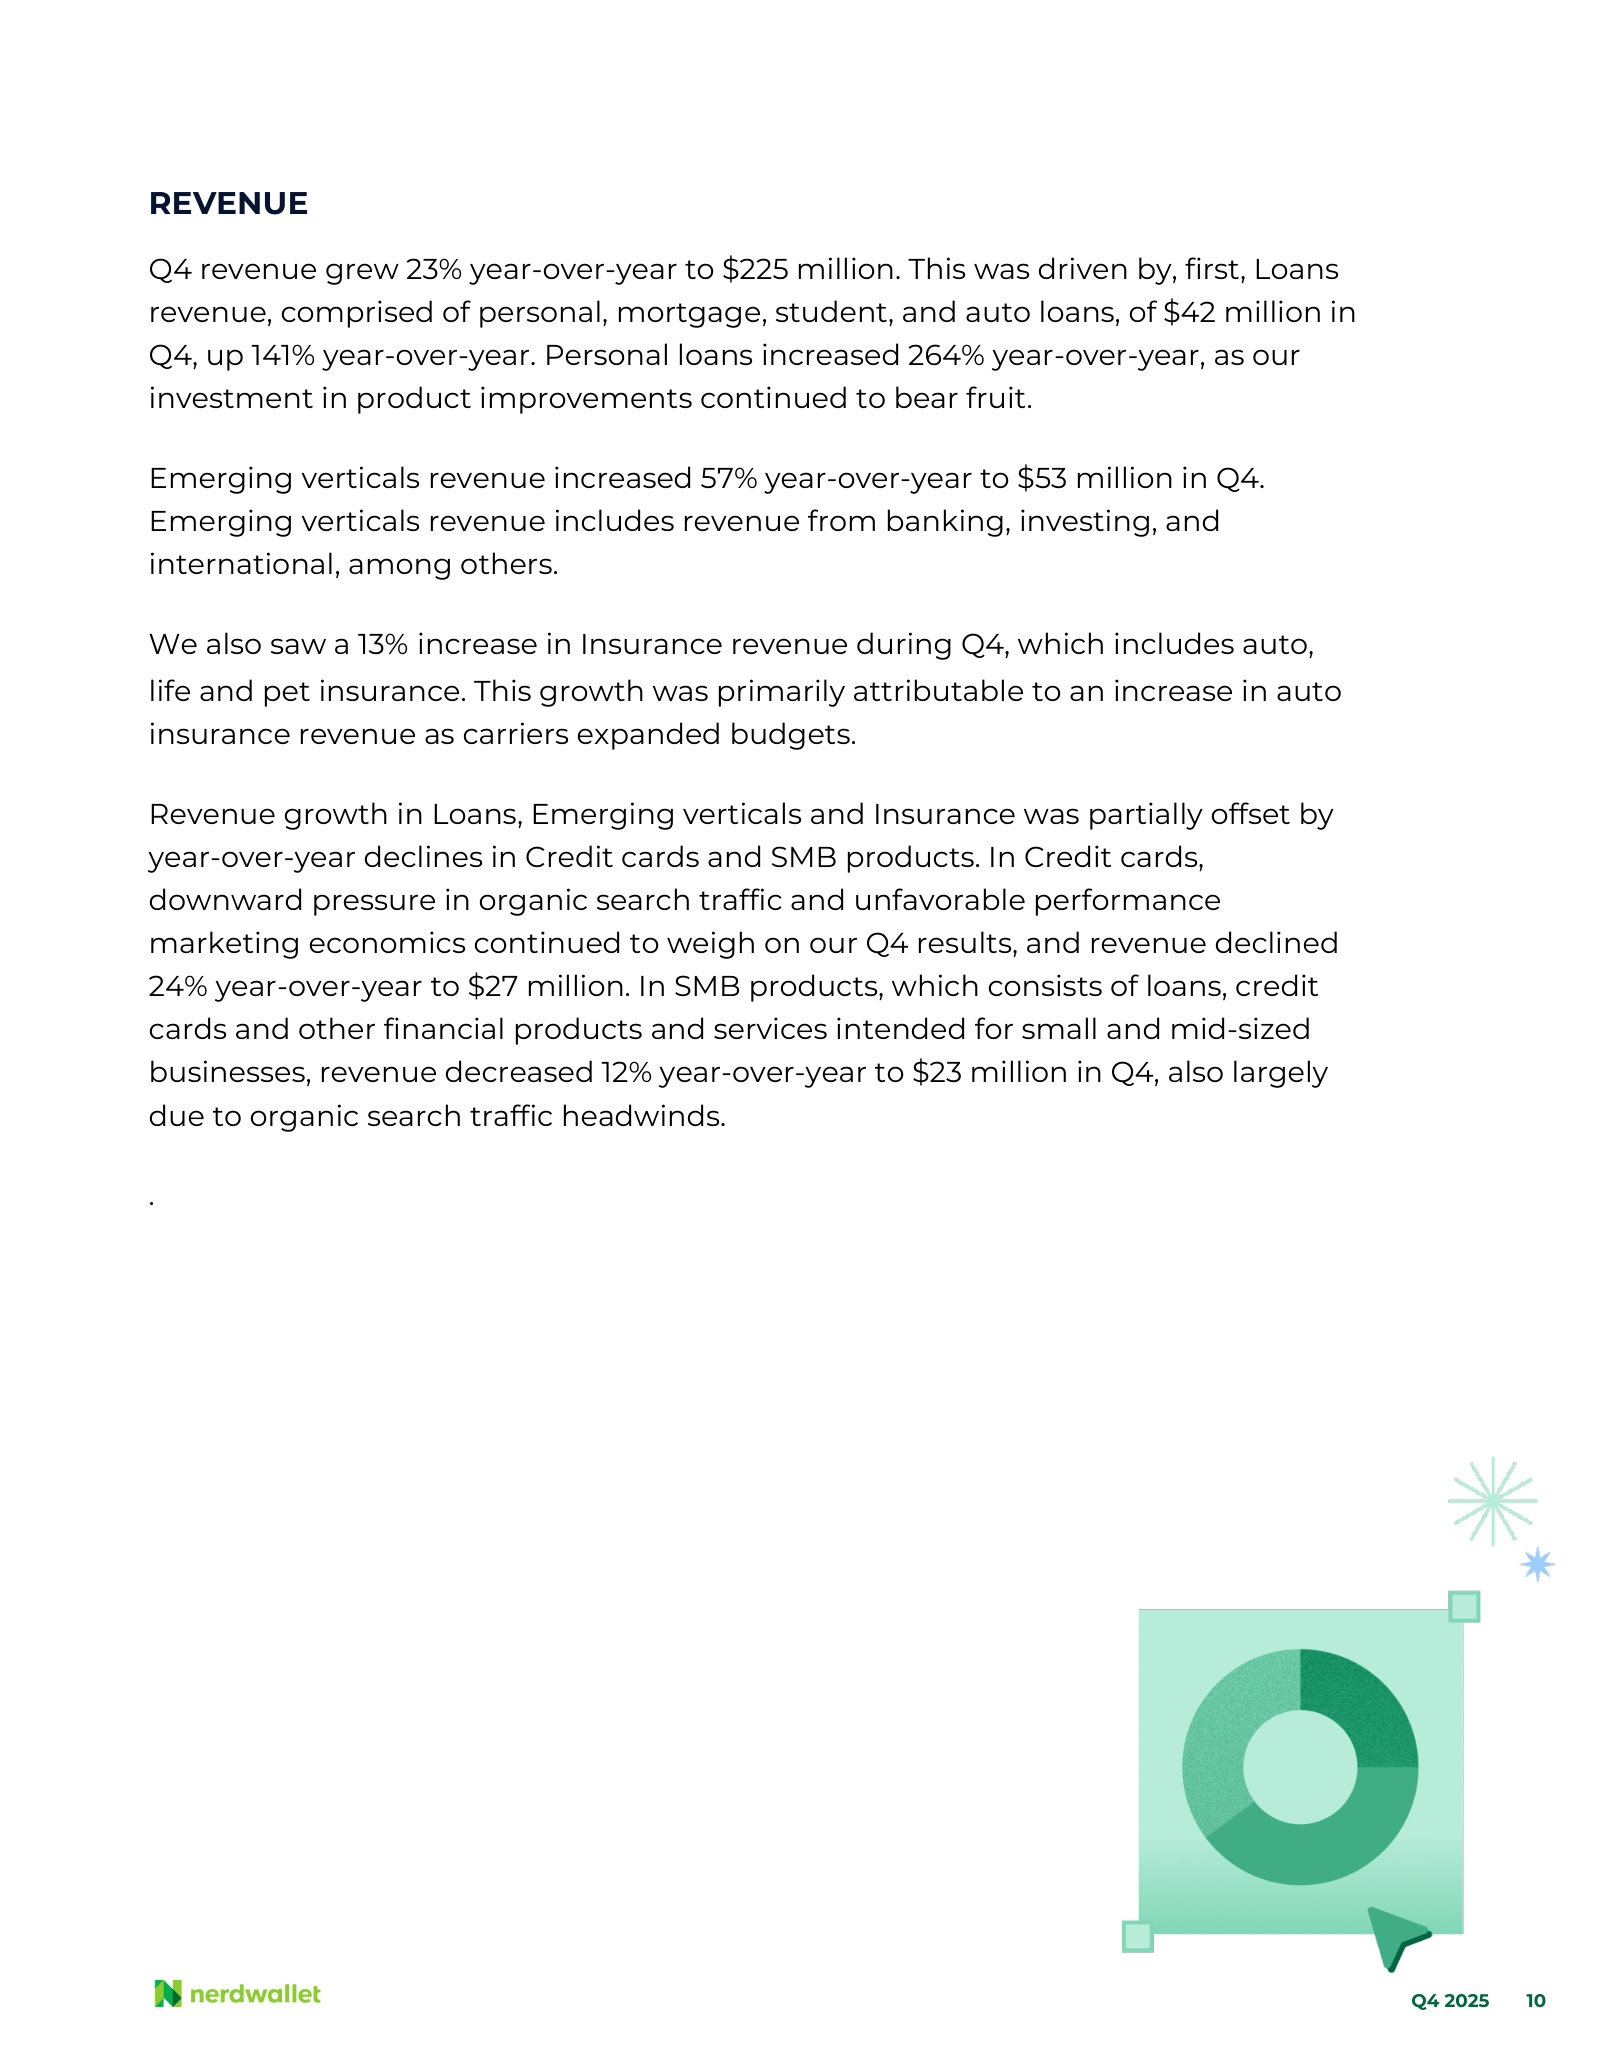
Jun Lee (Chief Financial Officer): Total revenue in Q4 was $225 million, up 23% year-over-year, exceeding our guidance range. This was driven by a 28% revenue growth in our consumer verticals, partially offset by a 12% revenue decline in our SMB vertical. Within consumer, insurance revenues increased 13% year-over-year, driven by robust auto carrier demand. Lending revenue increased 141% yearover-year, driven by a 264% growth in personal loans and double-digit growth in mortgages and other loans. Emerging Verticals revenue grew 57% year-over-year, driven by banking as we leveraged conversion data provided by our partners to gain share in a healthy demand environment. Looking forward, we are cautious on the outlook for our banking business as lower interest rates could reduce demand for high-yield savings accounts as the year progresses. Credit card and SMB revenues declined 24% and 12% year-over-year, respectively, driven by organic search headwinds.
p. 2 · Read in context →
Whether LLM referrals add demand or cannibalize search — the evidence management is actually looking at.
Michael Infante (Morgan Stanley); Tim Chen (Co-Founder & Chief Executive Officer): I'd be curious on the LLM-based referral traffic in terms of what you guys can see, whether or not it's actually incremental to the business or if you're seeing some level of cannibalization relative to existing organic searches? […] Yes, I'll take that one. So we're definitely seeing what we believe is incremental. People, I think, are searching more both on traditional search engines as well as large language models. We see that in the industry data. And then in terms of what we're seeing on our side, the conversion rates on that LLM referral traffic are much higher and growing rapidly. So we do believe it's incremental.
p. 3 · Read in context →
Pressed on margin erosion from the paid-traffic mix shift, the CFO refuses a margin-percentage target and says why.
Michael Infante (Morgan Stanley); Jun Lee (Chief Financial Officer): Okay. That's helpful. And then is there a way to sort of help quantify how much of a drag the persistence of these organic traffic headwinds are as it relates to the 2026 profitability outlook? I'm just trying to understand how we should think about any potential continuation of this performance marketing intensity and if you view that as a form of medium-term headwind to margins. […] Yes, I'll take that. So I believe your question is, how should we think about SEO headwinds? Is that right? Yes. So first of all, we're not solving for a margin percentage. We're focused on adding non-GAAP operating income dollars as we discussed. Given the mix shift changes in performance marketing and organic, revenue tends to be not as correlated to NGOI and free cash flow, and focusing on margin percentage targets would be limiting for our flexibility as we need to make the right economic decisions for our shareholders. It is true that what you have seen is correct where we are experiencing a decline in organic revenue, but we have been, at least from a revenue perspective, more than offsetting that with our performance marketing revenue. In order to guide you, I would point to our performance marketing spend trend over the last couple of years. I think that will give you a pretty good sense of how to think about our revenue growth from a performance marketing standpoint in the outer years. At the moment, we're not guiding specifically to revenue channels.
p. 3 · Read in context →
What vertical integration is for: converting a transactional referral into a relationship with better unit economics.
Jed Kelly (Oppenheimer); Tim Chen (Co-Founder & Chief Executive Officer): Just given the current landscape, you've got a strong brand and broad distribution with a lot of your financial service partners. Can you give us an update on how you're thinking about vertical integration and how that strategy is going to create a more sticky relationship with the consumer? […] Yes. It's a good question. Typically, we're comparing, like you said, our brand and reach with better consumer experiences, stickier consumer experiences. We're pretty happy with the way that's playing out. Typically, you go from a transactional relationship into a relationship with better unit economics and a lot closer relationship in terms of understanding what the customer needs. So we continue to see opportunities there. We are quite often the preferred acquirer when we get into corporate development conversations. So we continue to look forward to just being prudent but opportunistic on vertical integration.
p. 3 · Read in context →
Asked whether LLMs will disintermediate the marketplace, Chen names two obstacles: licensing and carrier willingness to quote.
Tim Chen (Co-Founder & Chief Executive Officer): Yes, it's a good question. If you think about the scenario where you're trying to do some form of agentic shopping or LLMs are trying to get more integrated, there are two obstacles you need to think about. First is regulatory. For example, you can't get an insurance quote from someone without an insurance license. Across credit, insurance, mortgages and investing, they require licensing where institutions need deterministic and compliant outputs, not probabilistic answers. That isn't optional for any intermediary, whether it's us or some kind of agentic solution. Second, the financial institutions need to buy in and participate. For example, an insurance company can refuse to quote an AI agent that is shopping around by inserting a multifactor authentication step. Two-sided marketplaces really only work if lenders and insurers want to participate. They bear real cost to quote and service demand. If agent-driven traffic hurts their margins or compliance posture, they can simply block it. So I do think there will be changes in terms of how consumers engage. But in financial services, usefulness at scale requires both the licensing piece, that compliance infrastructure, and the institutional buy-in, not just an agentic flow. So we think we're pretty well positioned to deal with all that.
p. 4 · Read in context →
Answering what actually makes paid channels work: brand halo, first-party data, and cross-merchandising across verticals.
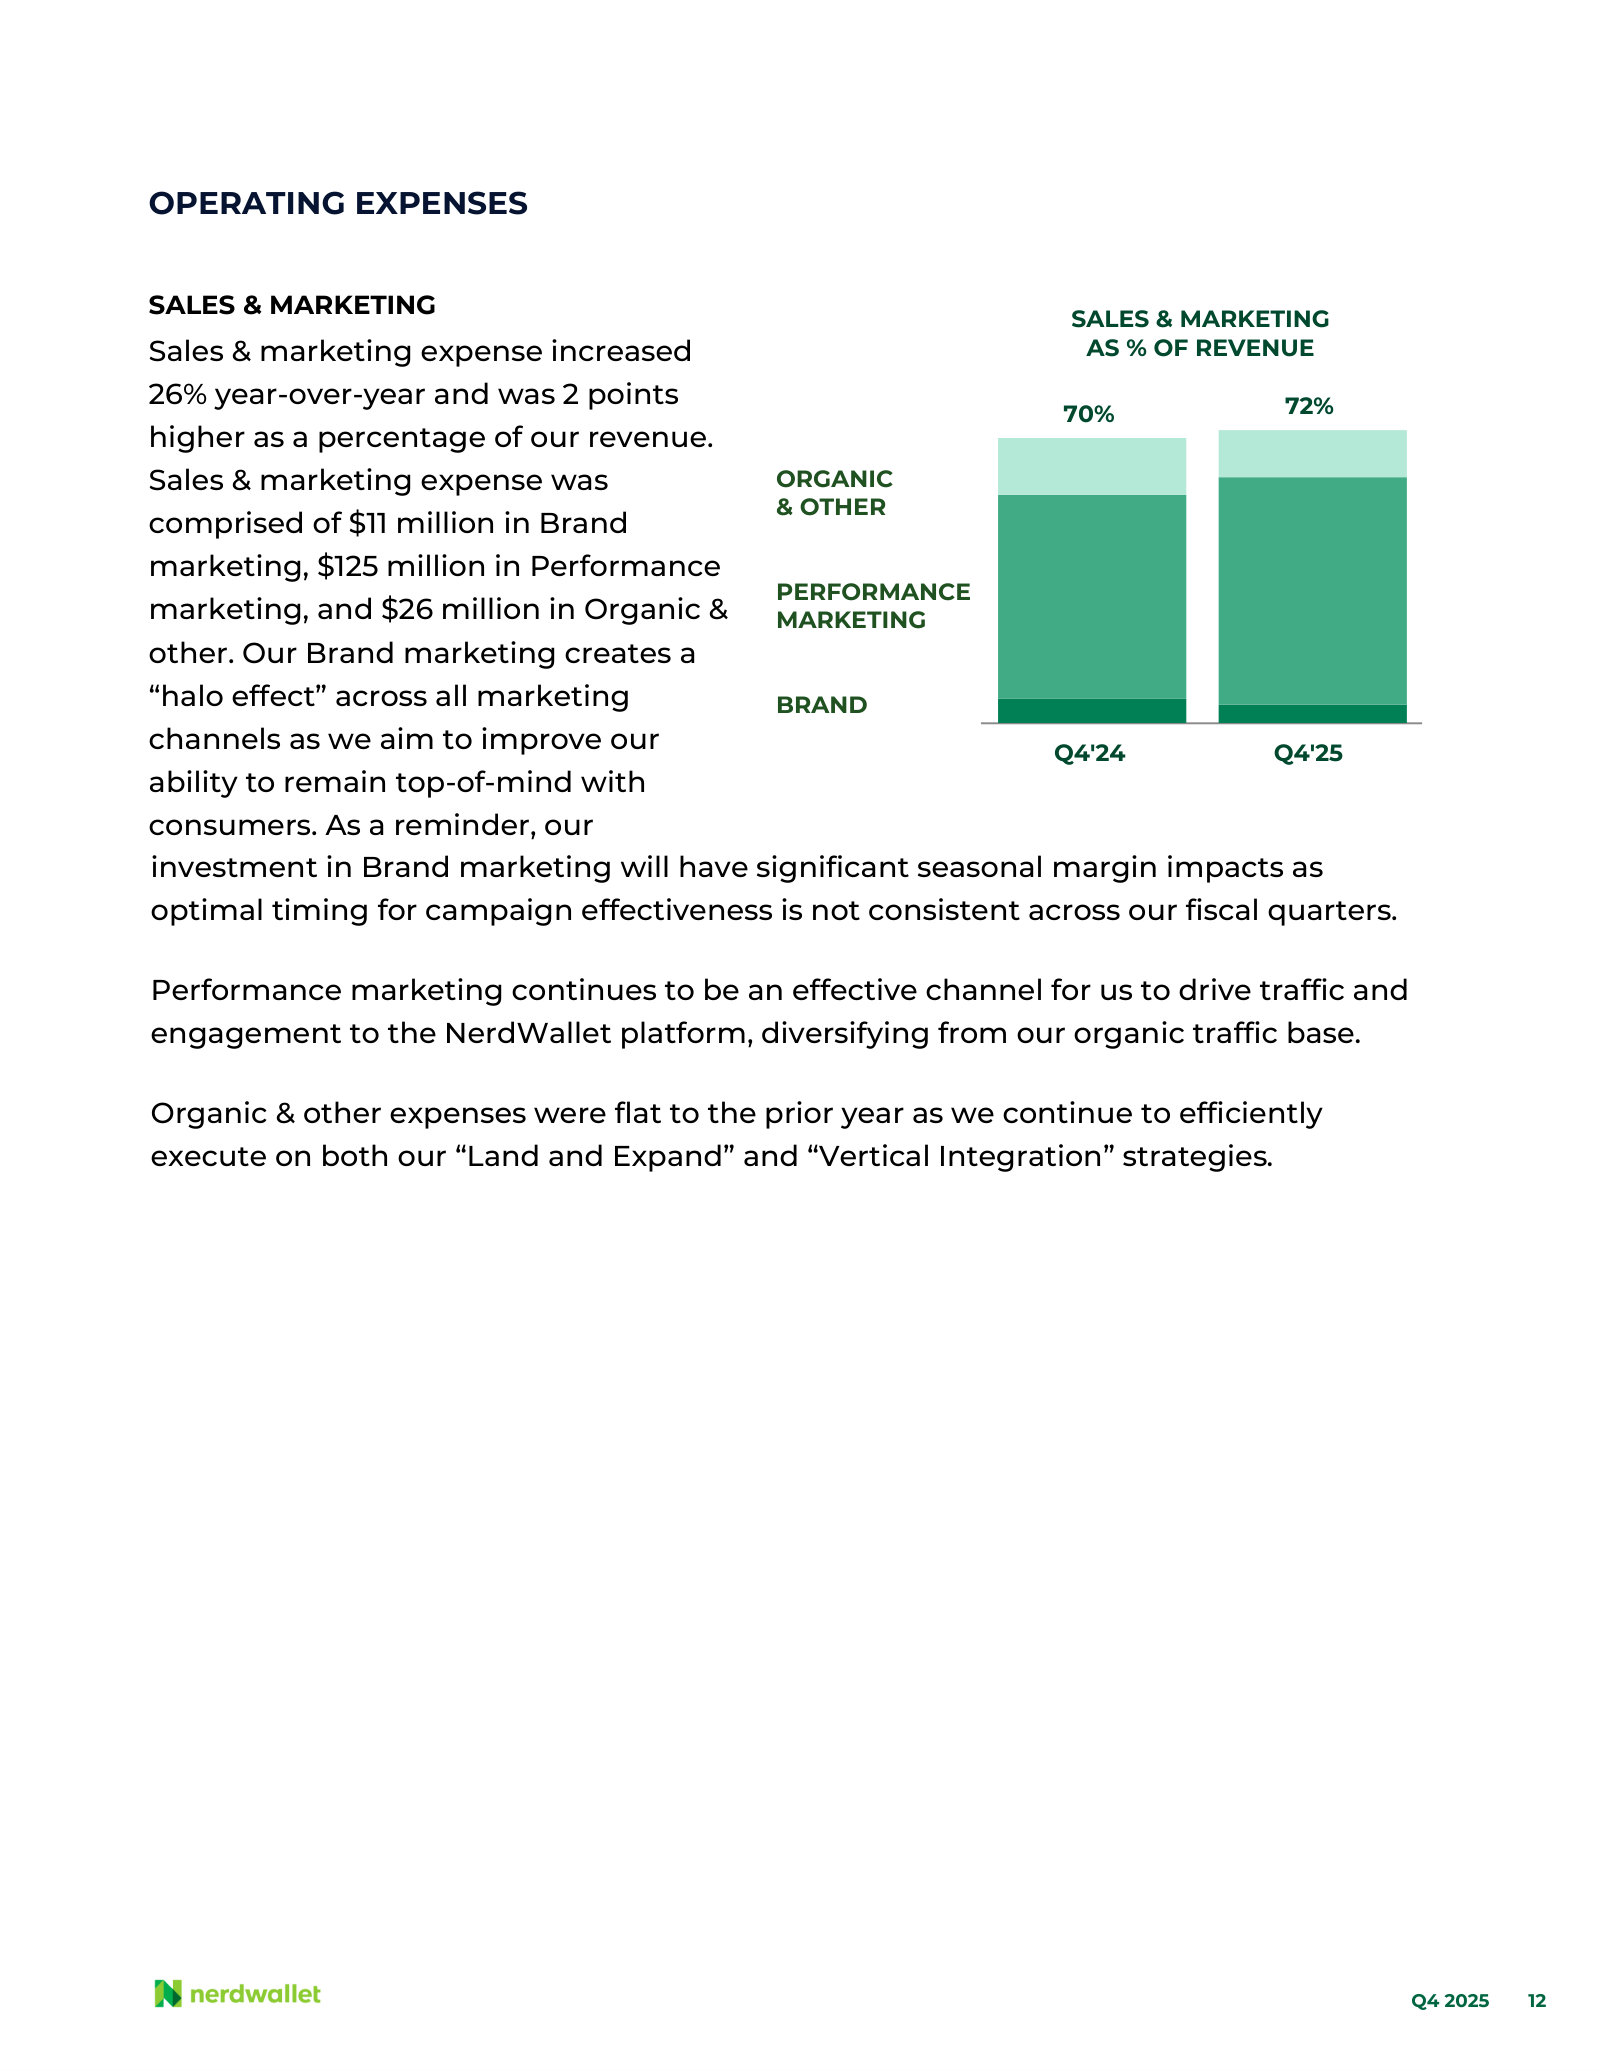
Tim Chen (Co-Founder & Chief Executive Officer): Performance marketing has been working pretty well for us. We think our brand is a halo across all of our performance marketing efforts. What we know about the consumer and our data infrastructure is a big part of enabling that as well. Our vertical-by-vertical expertise is also a factor that helps, especially across channels like Meta or CRM in terms of driving improvements. In terms of efficiencies, over time, being a one-stop shop across many different products has advantages. We're thinking hard about how to use the various parts of our business to strengthen every other part of our business with internal cross merchandising. Those things all start to work together well over time, and I think it's a big factor behind our success.
p. 5 · Read in context →
Q3 2025 Earnings Call — Q3 2025
The clearest account of how NerdWallet replaced lost search revenue: widen the lender panel below prime, then buy the traffic. · Open the full transcript →
The mechanism behind the offset: serving below-prime consumers is what made performance marketing scalable.
Tim Chen (Co-Founder & Chief Executive Officer): The first longer-term initiative is our effort to build on our key competitive advantage, our trusted brand and distribution. While our mission has always been to provide financial guidance to all consumers, our product offering has historically been geared toward the prime market. Over the past 12 months, we've undertaken efforts to expand our shopping experiences by offering more products to below-prime consumers, broadening our appeal. This has allowed us to scale our performance marketing capabilities, which have in turn offset headwinds in organic search. Beyond performance marketing, we are seeing momentum with referrals from large language models or LLMs, where our trusted brand has made us the most cited source in our competitive set. Although our traffic from LLMs is currently small, these consumers appear to convert at a much higher rate than traditional organic traffic. So we will continue to invest in growing this channel.
p. 1 · Read in context →
Asked what is driving LLM referrals, Chen points first to AI Overviews inside Google, not to chatbots.
Ross Sandler (Barclays); Tim Chen (Co-Founder & Chief Executive Officer): Yes. Thanks, Ross. On the first question, I'd say the primary driver to think about is actually AI overviews within Google Search. So because search is becoming more useful, people are searching a lot more. And so we are seeing traffic come through from AI overviews. ChatGPT and Gemini are also driving an increase there. So those are kind of the two major drivers in terms of the LLM traffic. When people come through that way, they're really high intent typically, they're really held in on finding something in a marketplace, for example. So I think that's what's driving some of the higher transaction rates there. And then on the banking one, we continue to see a lot of strength there, both in terms of consumer demand as well as partner demand even as rates have come in a little bit. So that and we continue to work on improving our product funnels to better match users with the right intent. So nothing beyond that.
p. 3 · Read in context →
An $8 million brand underspend explained as a creative-strategy pause, not a structural cut — with the run-rate restated.
Ralph Schackart (William Blair); Tim Chen (Co-Founder & Chief Executive Officer): You talked briefly about reevaluating the process or looking at brand spend. I think you maybe underspent by $8 million or so in the quarter. It sounds like you're going to probably pick that back up next quarter. But the question is, I guess, why did you go through the reevaluation process? And what did you learn after going through that process? […] Yes, I'll take that one. Brand is our biggest asset, right? And you'll note that the brand spend was down significantly because, as you mentioned, we underspent by $8 million in Q3. We were really just reevaluating our brand creative strategy during the quarter. Really excited about some things to come in Q4. I won't spoil it for you, but we're always trying to figure out how to make things more impactful. So in Q4, we do expect to return to more typical levels of brand spend. Last year's Q4 '24 spend is a pretty good proxy.
p. 3 · Read in context →
On below-prime: not a content pivot but a supply-side fix — filling out the panel of lenders in the marketplace.
Tim Chen (Co-Founder & Chief Executive Officer): Yes. So the way I describe it is we've always had content and products for all consumers, including below prime. It's really just historically, our monetization has skewed very heavily towards Prime because of the products that appeared in our marketplace. So it's really not a new strategy. It's really about filling out our panel with lenders and service providers to round out that marketplace. And what we're seeing is the second order impact there is it's making us more competitive in channels like performance marketing. And from a consumer perspective, honestly, we're just better serving unmet needs that we weren't serving before. So we feel good about that, too.
p. 4 · Read in context →
Q4 and Full Year 2024 Earnings Call — Q4 FY2024
The pivot call: insurance goes from nothing to the largest vertical, the traffic metric is retired, and the margin target becomes a dollar target. · Open the full transcript →
Why the margin-percentage target was replaced with a dollar target, plus the rule paid marketing has to obey.
Lauren StClair (Chief Financial Officer): We also expect that this revenue recovery will come from both unpaid and paid channels that will help with overall profit dollar growth. As a result, we will have a larger portion of our revenue growth coming from paid marketing this year. Though, as we’ve mentioned in the past, we view paid marketing as a means to an end and will continue to spend in a disciplined manner with the aim to be paid back within the quarter in which we spend. As a result of this traffic mix impact, we are moving from a margin percentage target to a margin dollar target as we continue to leverage our brand strength to take share in paid channels. When looking out past 2025, we are also replacing our previously shared margin percentage target with a margin dollar target, and we now plan to deliver at least $80 million of non-GAAP operating income in 2026, with this continued level of profitability growth depending on the timing of the recovery in our lending portfolio.
p. 4 · Read in context →
Whether insurance growth was funnel work or bought traffic — and the end-market inflation underneath it.
Ross Sandler (Barclays); Tim Chen (Chief Executive Officer): Hey Tim. Hey Lauren. Just two quick questions for me. So first on Insurance, I mean, this segment’s basically gone from nothing a year ago to now your largest segment by a decent amount. So, I guess, how much of that is from kind of changing the flow of traffic pattern through the site, like you mentioned, collecting more information and maybe tweaking the direct or organic traffic patterns versus just running lots of incremental performance marketing to insurance landing pages. Could you talk about how you’re like kind of balancing that with the future of other sectors, other categories start to kind of pick back up again? That’s the first question kind of high level. And then the second one, Lauren, the Q1 guide assumes a pretty hefty amount of margin contraction. And, I know you’re not guiding to margins anymore, but is that the Super Bowl commercial plus other factors, just any additional color on the Q1, I guess, OI or OI margin either way? Thanks a lot. […] Sure. I’ll kick it off. Ross, I think you’re spot on. We have improved the flows to the site. We’re personalizing the user experiences more. And that’s really tight to enabling us to be more proficient in performance marketing. I think it’s worth calling out to the end market is also growing. Auto insurance costs are up over 50% over the last 5 years as inflation and rising risk drive up premiums. And this means the end market is expanding as well.
p. 5 · Read in context →
The structural case for insurance — direct taking share from agents — and why the same playbook should port to lending.
Tim Chen (Chief Executive Officer): the last thing to think about there too is, the direct channel where we primarily play is taking share from the agent channel, which is also another structural tailwind for us. In terms of the durability of that consumer demand in auto insurance, depending on which data source you’re looking at, new policies in 2024 were about 20% to 30% higher than in 2023. And 2023 was an easy comp, because it was a hard market. So, there weren’t a lot of options to switch back then. And that gives us confidence that these current trends are sustainable. And so, looking ahead, we see far lower growth rates in insurance as we lap the hard market, but really encouraged by the level of positive feedback we’re getting from partners about the quality of shoppers coming from NerdWallet. So, we think our brand is a real differentiator here. To the point about how this affects things when other verticals pick up, not a ton. It does make me very optimistic, though, that like insurance, a lot of lending verticals have risk-based pricing. So, growing our top-of-funnel there can sometimes be dependent on more personalization and serving routing customers to the right options for them. So, we think that some of the things we’ve learned and improved on over the cycle will apply to areas like personal loans and mortgages as well over the next cycle.
p. 6 · Read in context →
Retiring the monthly-unique-user metric: growth in users and revenue had gone inversely correlated.
Justin Patterson (KeyBanc); Lauren StClair (Chief Financial Officer); Tim Chen (Chief Executive Officer): Great. Thank you very much. And best of luck with the new opportunity, Lauren. I was hoping you could put a finer point on this shift in traffic strategy. What did you observe among new MUUs or an ROI from marketing channels that drove this decision to focus more on quality of the relationships? And then how does this change your view of the long-term growth profile you outlined around this time last year? Thank you. […] Yeah. So, maybe I’ll just reiterate some of the comments around our choice to shift from the metric of MUU. And then, Tim, if you want to add some thoughts on that, and then we can talk a little bit about sort of the longer-term. But, over the past few quarters, growth has been inversely correlated between MUUs and revenues, so MUUs have not been a good proxy. And as Tim did mention in remarks, given our focus on quality over quantity through Vertical Integration, we do not believe that MUUs are the best measure of our progress in these areas. We were able to prioritize and show meaningful MUU growth, while we were solely focused on our digital marketplaces. But, as we’re shifting resources to longer-term priorities, we’re now goaling our internal management teams on non-GAAP OI and not MUUs. […] Yeah, speaking to the longer-term growth profile, I mean, so we’ve got three growth pillars, right? The second one and third one, Vertical Integration and Registration & Data-Driven Reengagement. So, yeah, the bang for our buck in terms of getting a lot of our existing users into deeper relationships is just so high relative to just growing the top-of-the-funnel. So, yeah, in my prepared remarks, I talked about the Next Door Lending example. I mean, you think about, someone coming in and reading about mortgage rates being quite less valuable than someone who we actually get on the phone with and broker a transaction with, right, and yet those are equivalent MUUs. So, the operational focus has really turned to doing better with the MUUs we have.
p. 6 · Read in context →
The hard question — is AI different from past Google algorithm changes — and the industry data Chen answers with.
Ralph Schackart (William Blair); Tim Chen (Chief Executive Officer): Right. And then, Tim, throughout the many years on the Internet, there’s been a lot of algo changes at Google and the market has responded. And, I guess, as you are sitting here today and sort of operating this business, obviously for a while here, how different do you think these changes are to the business with AI overviews and some digital buyers are saying that the ads that are generated from Gen AI are actually performing better than some of the organic results. So just kind of curious, what’s your confidence that this is something you’ll be able to navigate longer-term versus your previous history? Thanks a lot. […] Yeah. So, I’ll split it up between kind of the shorter-term stuff we’re seeing and longerterm thoughts. I mean, in the near-term, there are two drivers here, right, which is one is more ads and modules on top of the search results. And the other factor is rank, where in the very recent past financial institutions and some government websites are winning in some areas where they traditionally haven’t, which as I’ve alluded to in past calls is a bit of a head scratcher when considering consumer intent. So, we do think this period of frenetic testing will eventually stabilize and when that happens, it should play to our favor. Longerterm, I do think that it’s important to look at broader industry trends, right? So, first AI search engines or chatbots, are they taking share from traditional search engines? I mean, from what we can tell, not really. If you like top down, more people are using search engines than they did last year, but you also see triple-digit growth in AI usage, which says to me that people are basically just asking more questions that they weren’t asking before.
p. 7 · Read in context →
The distinction the whole search debate turns on: AI answers the simple pages, not the marketplace pages that monetize.
Tim Chen (Chief Executive Officer): if simple questions have simple answers, and if a search engine can serve that up in a faster way that consumers prefer, then that’s good for the ecosystem. And for us, we’re seeing these features do a really good job of answering simple educational questions, and that has been affecting traffic to some of our non-commercial pages. That has not been the case yet for our monetizing pages, which are fundamentally just a little more complicated, right? Like if you need to shop for a mortgage, for instance, you really need to go through a marketplace experience. So, yeah, on balance, we think that this period of frenetic testing will stabilize. We’ve seen a few things like this in the past, and we can grow from there.
p. 8 · Read in context →
How financial-institution partners actually decide where to spend: an LTV-to-CAC calculation, not a share auction.
Pete Christiansen (Citi); Tim Chen (Chief Executive Officer): Thank you. Good evening. Tim, I guess now with the revised traffic strategy, which makes a ton of sense, engagement wise, all that, but how are you thinking about competitive share and how important is that still a factor for a lot of your partners when they’re evaluating spending on one platform versus another? Just love to hear your thoughts there on competitive market share. […] Yeah. So high level, I think of partners as being quite quantitative and analytical. When they’re looking at partners like us, it comes down to what’s the LTV of the customer that they’re driving through. And, anecdotally, we have consistently gotten very positive feedback in many different verticals that our customers understand the products, they understand why this is a great choice for them, and that leads to good outcomes for both the partners and for NerdWallet. So, in terms of share, I don’t really think of it as a zero-sum game between different partners. I think a financial institution is basically making LTV to CAC calculation and wants as many customers as they can get typically, and we tend to be a preferred channel there.
p. 8 · Read in context →
Q2 2024 Earnings Call — Q2 FY2024
The shock call: a Google algorithm update breaks organic traffic, management misses its own profit guidance and cuts $30 million of cost the day before. · Open the full transcript →
The diversification argument stated as a mechanism: insurance is mandated by law, so it does not move with the credit cycle.
Tim Chen (Chief Executive Officer): Our business is cyclical, and headwinds and tailwinds will offset each other over time. So our priority is growing from cycle to cycle, which we've done through a pandemic, a regional banking crisis, a prolonged zero interest rate period, and a series of rate hikes. A large part of our ability to grow consistently through such a varied set of cycles has been our diversification since macroeconomic conditions pressuring one area of our business will tend to lift another area of our business. In Q2, we hit an air pocket in the cycle. The banking market started to decelerate as consumer demand for products like high-interest savings accounts waned, but the absence of rate cuts and elevated delinquency rates means we have not yet seen a corresponding uptick in our loans business. We expect a tailwind in loans and credit cards when widely anticipated rate cuts materialize and as delinquency rates stabilize then improve. However, this quarter, we saw a significant uptick in our insurance business, which grew revenue 196% year-over-year as carriers came back online and consumer demand increased. Because insurance is legally mandated, it is not subject to the same credit cycle drivers as our other verticals, and our results in the category this quarter further highlight the benefit of our diversification.
p. 1 · Read in context →
The registration economics — 22 million users, 5x lifetime value — set against a same-week reduction in force.
Tim Chen (Chief Executive Officer): Second, we have made significant improvements to our insurance marketplaces that have opened up the ability to scale performance marketing channels while registering a large percentage of traffic, allowing us to proactively reengage these consumers over time. This contributed to increasing our cumulative registration base to 22 million users in Q2. We've extended these improvements to other verticals, which should increase our ability to pay to acquire users profitably while registering more of our traffic as macro conditions accelerate our loans business. These registered users should lead to future organic growth as registered users have five times the lifetime value of non-registered users. […] We have made strategic decisions to reduce portions of our cost base. As a result, yesterday, we completed a reduction in force, which we expect to lead to approximately $30 million in annualized cost savings.
p. 2 · Read in context →
Chen's account of the algorithm update, with a worked example of what a broken result page looks like and what it cost.
Ralph Schackart (William Blair); Tim Chen (Chief Executive Officer): Just wanted to touch on the search traffic commentary and as well as organic. I think in the prepared remarks on the call, you had said some of that organic traffic had returned. Just want to get a sense of how much of that organic traffic has returned since the quarter? And then I have a follow-up, please. […] Yes, I'll take that. So during Q2, yes, like we said, a major algorithm update created meaningful headwinds on our search traffic, and to a lesser extent, our traffic. So I'd characterize it as saying it's stabilized and started getting a little better. Generally speaking, we think search is working well when it matches user intent and surfaces the best answers. And by that standard, we and a lot of industry observers felt like things went a bit haywire last quarter. So for example, let's say you're searching for a small business loan. You ideally, I think, want to comparison shop relevant choices, leveraging a brand you trust. And so if you see a government website explaining what a small business loan is, that doesn't help; neither does it help to see a nonprofit website showcasing local grants, nor is it helpful to see a regional bank that doesn't do small business loans, right? So we think it's inevitable that some of these kinks get worked out because there are strong commercial incentives for search engines to get it right. They want happy customers who keep coming back so they can sell more search ads. So that being said, given recent volatility, we baked in some extra conservatism going forward. And we've taken out about $30 million in annualized costs, which feels appropriate, but this would turn into a tailwind if things get better. And so our past experience tells us that a period of testing like this tends to be followed by a long period of normalization. And in the long run, matching user intent and high-quality content is really a win-win. So I mean, we took a $2.7 million hit on Q2 non-GAAP operating income versus the midpoint of our prior guidance, which is definitely not how we want to show up as stewards of your capital. However, relative to the magnitude of the headwinds we saw, it does highlight the progress we've made, I think really over the past five years in building a brand and registering users; those things have insulated us from a worse outcome. And so looking forward, the investments we're making behind registered user experiences like NerdWallet+, and in vertical integration will further diversify our business from any particular channel and deepen our direct relationship with our users.
p. 5 · Read in context →
The performance-marketing rulebook: 70% organic traffic, in-quarter payback, and a spend lever that can be pulled either way.
Justin Patterson (KeyBanc); Lauren StClair (Chief Financial Officer): And then I just wanted to come back to something you're closing with just around marketing. Should we be thinking about this as just a prairie mix shift toward more paid marketing over the near term? Or is this more kind of like a higher for longer paid marketing that's not something that should be like a bigger piece of the business going forward? […] Justin, I'll take this one. So despite some of the recent challenges we've called out in organic search traffic, we still see that over 70% of our traffic comes through organic channels. And that's allowed us to reinvest in more acquisition channels like brand and performance marketing. Our approach on how we operate performance marketing, though, has not changed. We do so in a disciplined way, aiming to be in-quarter profitable and adding incremental non-GAAP operating income dollars. We also remind everyone to keep in mind that we look at performance marketing as a variable expense, and we can dial it up or down depending on our returns. And we also view it as a means to an end as part of our registration and engagement initiatives. We see increased spend as a positive as performance marketing is a flexible lever to add incremental non-GAAP operating income dollars, getting more folks the opportunity to register and to continue to take share. In Q2, we leaned in a bit more due to the strength we saw in areas such as insurance, and where we see opportunities in the future, you can expect us to invest more heavily. And in verticals where we're seeing conservatism with partners, you'll see us pull back, which we can do in pretty short order.
p. 6 · Read in context →
NerdWallet+ unit economics laid out for the first time: a $49 annual fee against up to $350 of rewards.
Michael Infante (Morgan Stanley); Tim Chen (Chief Executive Officer): And then for my follow-up, I just had a couple of questions on the NerdWallet+ membership. I was looking at sort of some of the rewards payouts, and it looks like the reward for opening a credit card is roughly 2x out of debit. So I was curious, is there any read there just in terms of maybe the bounty or the pricing that's being paid for opening up a credit card versus another product? And sort of as we sort of play this out over the medium term, do you intend to sort of roll out some of that rewards functionality across the full breadth of solutions that you have on the platform? […] Our third growth pillar focuses on registration and data-driven engagement. NerdWallet+ is a paid membership that rewards users for making smart financial decisions, which we believe is a valuable offering for consumers. Currently, we charge members an annual fee of $49, and they have the potential to earn back up to $350 through rewards linked to better financial choices or exclusive deals on financial products and tools. There is probably a correlation between the rewards we provide to users and the market rates for those products. As we aim to attract more users, we plan to invest more in this area to support our long-term vision.
p. 7 · Read in context →
Asked how far to push the insurance upcycle, Chen anchors on 3x the 2021 peak and refuses to oversell leads.
Tim Chen (Chief Executive Officer); Jed Kelly (Oppenheimer & Co.): Sure. Just to remind everyone, this insurance hard market has been ongoing for several years, and we have been making investments in product enhancements during this time. One of the most significant improvements has been in personalization, which has contributed to better conversion rates, allowing us to expand our paid marketing efforts significantly. For context, our Q2 revenue was nearly three times what we achieved in our peak quarter in insurance back in 2021, prior to the hard market. This represents a much greater improvement compared to what others are experiencing. As for the market returning, we are navigating some easier comparisons. We are confident we are doing this without compromising the integrity of our site by overselling leads. We believe this approach is the best long-term strategy. On the topic of insurance, looking ahead, we see substantial opportunities in Medicare and homeowners insurance, particularly as the housing market recovers. Broadly speaking, we still represent a small fraction of this market, indicating plenty of growth potential beyond just autos.
p. 8 · Read in context →
More calls
Q2 2025 Earnings Call — Q2 FY2025 · 4 pages · Go here for the mechanics of insurance distribution — why referrals run through third-party platform partners, and what switching one cost in a quarter — plus the new CFO's capital-allocation framework. · Open →
Q1 2025 Earnings Call — Q1 FY2025 · 8 pages · The Next Door Lending economics are quantified here: roughly 2x upfront unit economics versus a referral, 60-plus wholesale lenders compared, and refinance revenue later. · Open →
Q3 2024 Earnings Call — Q3 FY2024 · 8 pages · The 'learn' versus 'shop' traffic taxonomy that explains every later search discussion, and the first full description of the insurance super-cycle at 10x year-over-year. · Open →
Q1 2024 Earnings Call — Q1 FY2024 · 7 pages · The last clean pre-shock quarter: full vertical-by-vertical revenue walk and the original 2024 margin commitments, useful as the baseline the later years are measured against. · Open →
Q4 and Full Year 2023 Earnings Call — Q4 FY2023 · 11 pages · The first guidance miss as a public company. Chen describes the business as a matchmaker and explains breaking the near- and sub-prime matching algorithm; StClair lays out the three fixed-cost levers behind margin accretion. · Open →
Q3 2023 Earnings Call — Q3 FY2023 · 10 pages · Where the addressable-market and share-gain math is spelled out, and where management first explains why monetization skews prime even though the audience does not. · Open →
Q2 2023 Earnings Call — Q2 FY2023 · 10 pages · The plainest statement of the cycle-to-cycle operating philosophy, and the breakdown of sales and marketing into organic, performance and brand that later calls assume you know. · Open →
NerdWallet, Inc.'s annual reports contain management's most considered account of the business. These are the sections, passages and visual pages worth opening in the originals preserved in Sources.
NerdWallet, Inc. — FY2025 Annual Report (Form 10-K) — FY2025 (year ended December 31, 2025)
Latest 10-K, and the first to describe the business as a marketplace plus regulated subsidiaries; revenue $836.6M (+22%), net income $48.7M. · Open the full document →
Item 1. Business — p. 10 · Read the full section →
Rewritten this year: an editorial-and-marketplace platform that now also runs licensed brokering and advisory subsidiaries.
What the company is, how it is paid, and the two headline results for 2025.
NerdWallet, Inc. (NerdWallet, the Company, we, our, or us) provides consumers and small and mid-sized businesses (SMBs) with trusted guidance across a broad range of finance topics through a digital platform that integrates independent editorial content, comparison tools, data-driven product marketplaces, and access to regulated financial services offered through our subsidiaries. […] We generate revenue primarily through referral fees, lead generation, and partner-based monetization, as well as through revenue derived from brokering and advisory services. Our business model is designed to be partner-neutral and to support transparent consumer and SMB choice by offering side-by-side comparisons and insightful information supported by editorial standards. […] Our revenue was $836.6 million and $687.6 million for 2025 and 2024, respectively, representing year-over-year growth of 22%. We generated net income of $48.7 million and $30.4 million for 2025 and 2024, respectively, representing year-over-year growth of 60%.
p. 10 · Read in context →
The regulated subsidiaries that now sit beside the marketplace: a mortgage broker and an SEC-registered adviser.
We conduct mortgage brokering activities through NDL, a wholly-owned subsidiary licensed under applicable state laws. NDL provides consumer introductions, matching, and application routing to third-party mortgage lenders and supports certain intake and disclosure facilitation activities. NDL does not service mortgage loans or hold mortgage loans for more than 30 days. […] We provide traditional wealth management services through NerdWallet Wealth Partners, LLC, an SEC-registered investment adviser that offers financial planning, discretionary investment management, and related advisory services.
p. 14 · Read in context →
Item 1A. Risk Factors — We are dependent on internet search engines, particularly Google, to direct traffic to our websites and refer new users to our platform — p. 25 · Read the full section →
The structural risk for this business, and the only one the 2025 MD&A actually blames for a revenue decline.
Google algorithm changes have already cut traffic; AI-assisted search is named as the next threat.
Our reliance on internet search engines, particularly Google, for directing traffic to our platform, poses risks. Search engines, like Google, may modify algorithms or policies without prior notice, potentially resulting in significant declines in our organic search ranking and decreased platform traffic. Past changes have caused declines in traffic and user growth, with anticipated fluctuations in the future. The introduction and acceptance of AI-assisted technologies could further impact search engine relevance, causing declines in our ranking and decreased platform traffic, affecting our financial results.
p. 25 · Read in context →
The same risk, priced: MD&A attributes the credit cards and SMB declines to organic search pressure.
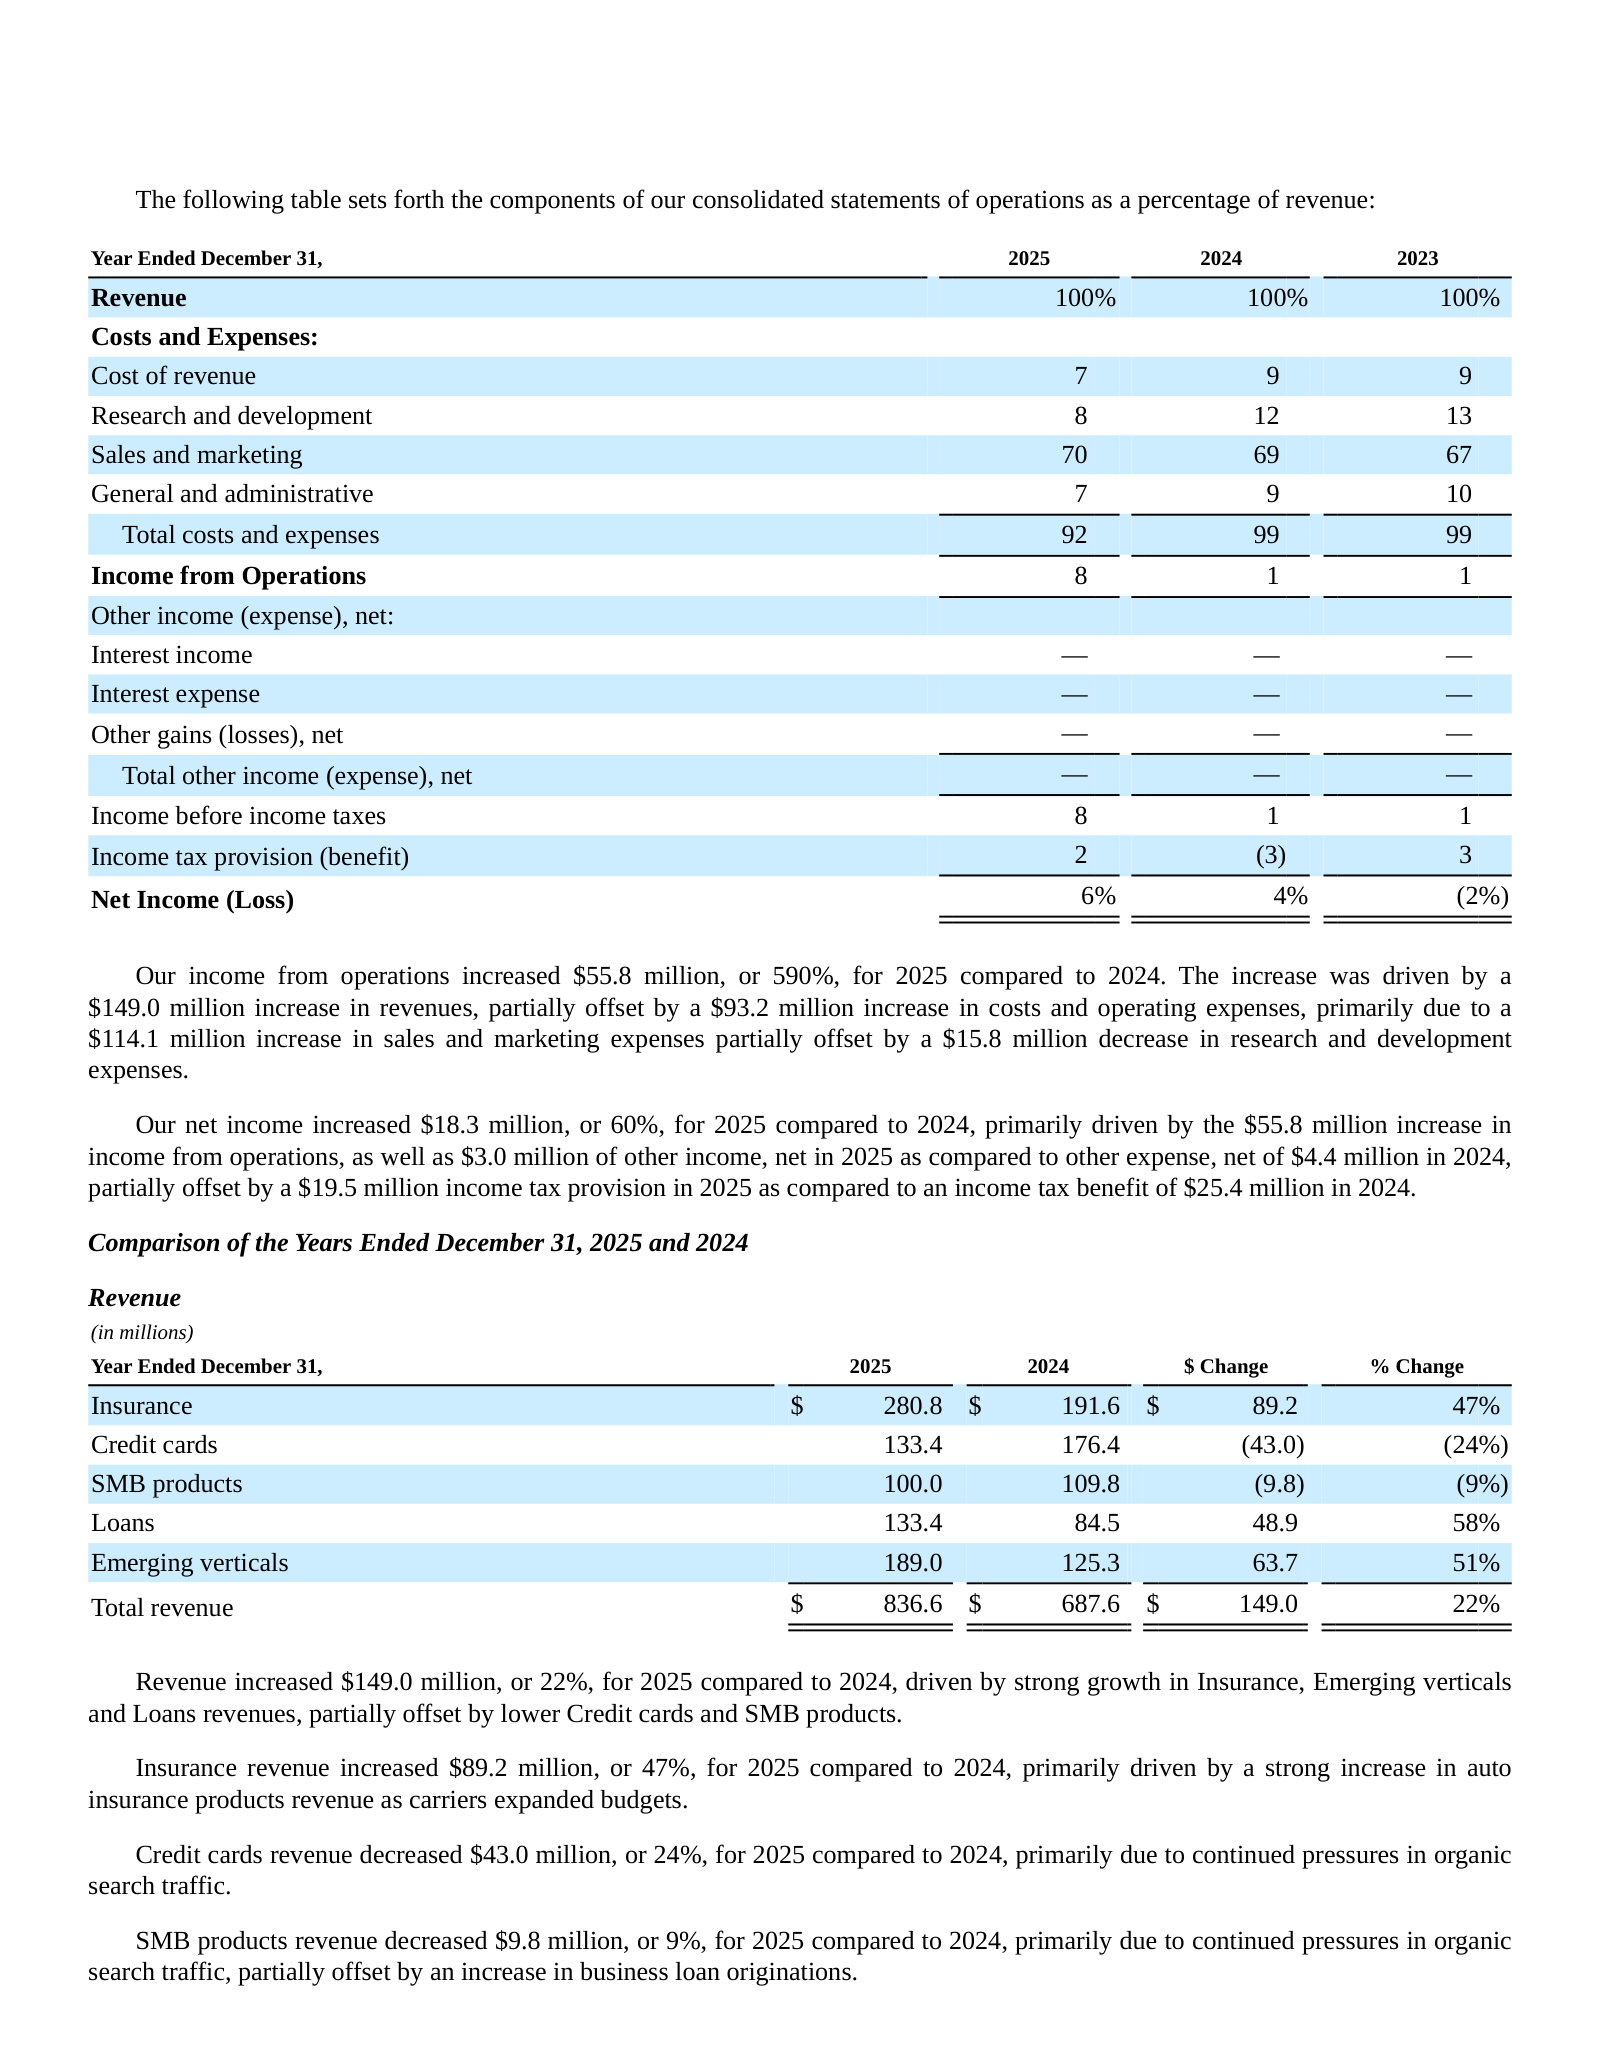
Credit cards revenue decreased $43.0 million, or 24%, for 2025 compared to 2024, primarily due to continued pressures in organic search traffic. […] SMB products revenue decreased $9.8 million, or 9%, for 2025 compared to 2024, primarily due to continued pressures in organic search traffic, partially offset by an increase in business loan originations.
p. 73 · Read in context →
Item 1A. Risk Factors — Our expansion into mortgage brokering presents additional risks — p. 28 · Read the full section →
NerdWallet now brokers mortgages and also runs a mortgage comparison marketplace; management concedes the conflict that creates.
Running a broker alongside the comparison marketplace creates conflicts management says it must manage.
Our acquisition of NDL in October 2024 and our expansion into mortgage brokerage services introduce additional risks. We must comply with complex federal and state regulations governing mortgage brokerage operations, including licensing requirements for both the entity and individuals in the states where NDL operates. […] Additionally, operating a direct mortgage brokerage alongside our existing mortgage marketplace comparison platform creates potential conflicts of interest that must be carefully managed to maintain transparency and trust with consumers and lending partners. Mortgage brokerage operations are highly sensitive to interest rate fluctuations, housing market conditions, and changes in wholesale lender policies, all of which could impact loan approvals, funding availability, and revenue generation.
p. 28 · Read in context →
Item 1A. Risk Factors — Macroeconomic developments such as inflationary conditions in the U.S. have caused macroeconomic uncertainty and may have an adverse impact on our business, results of operations and our vertical diversification strategy — p. 34 · Read the full section →
The clearest statement of the diversification thesis the whole model rests on — and of management's doubt that it keeps working.
Verticals are meant to offset each other; management declines to guarantee it, and names 2025's weak ones.
We began our business with our credit card vertical and have since grown our business to include additional verticals: mortgages, insurance, SMB products, consumer loans and debt solutions, banking, and investing. We believe that our vertical diversification strategy has allowed us to navigate different kinds of macroeconomic conditions; in the recent past underperformance in one vertical has been offset by overperformance in another. […] We cannot, however, guarantee that this offsetting between our verticals will continue or that our business model will be able to withstand the various macroeconomic developments we may see in the future. During 2025, we saw that uncertainty with the interest rate environment put pressure on our consumer loans, SMB products, and mortgage verticals.
p. 34 · Read in context →
Item 1A. Risk Factors — The dual class structure of our common stock has the effect of concentrating voting control with our Co-Founder, Chief Executive Officer and Chairman of our Board of Directors, Tim Chen — p. 49 · Read the full section →
One holder controls 89% of the vote, which is why NerdWallet is a Nasdaq controlled company with no independent nominating function.
Ten-to-one voting; the CEO and his trusts held ~89% of voting power at year-end 2025.
Our Class B common stock has ten votes per share and our Class A common stock has one vote per share. Tim Chen, our Cofounder, Chief Executive Officer and Chairman of our Board of Directors and his affiliated trusts hold all outstanding shares of Class B common stock, which as of December 31, 2025 constituted approximately 89% of the voting power of our outstanding capital stock. […] This concentrated control will limit or preclude your ability to influence corporate governance matters, transactions and all matters submitted to a vote of our stockholders, for the foreseeable future.
p. 49 · Read in context →
Item 7. MD&A — Key Components of Our Results of Operations: Revenue — p. 69 · Read the full section →
The unit of revenue, spelled out: partners pay per action, click, lead or funded loan, booked when the match happens.
Four pricing models, revenue at the moment of match, and the five reporting categories.
We generate substantially all of our revenue through fees paid by our financial services partners in the form of either revenue per action, revenue per click, revenue per lead, and revenue per funded loan arrangements. For these revenue arrangements, in which a partner pays only when a consumer or SMB satisfies the criteria set forth within the arrangement, revenue is recognized generally when we match the consumer or SMB with the financial services partner. […] Our revenue generally includes five product categories: Insurance, Credit cards, SMB products, Loans and Emerging verticals. Insurance revenue includes revenue from consumer insurance products, including auto, life and pet insurance.
p. 69 · Read in context →
Item 7. MD&A — Comparison of the Years Ended December 31, 2025 and 2024 — p. 73 · Read the full section →
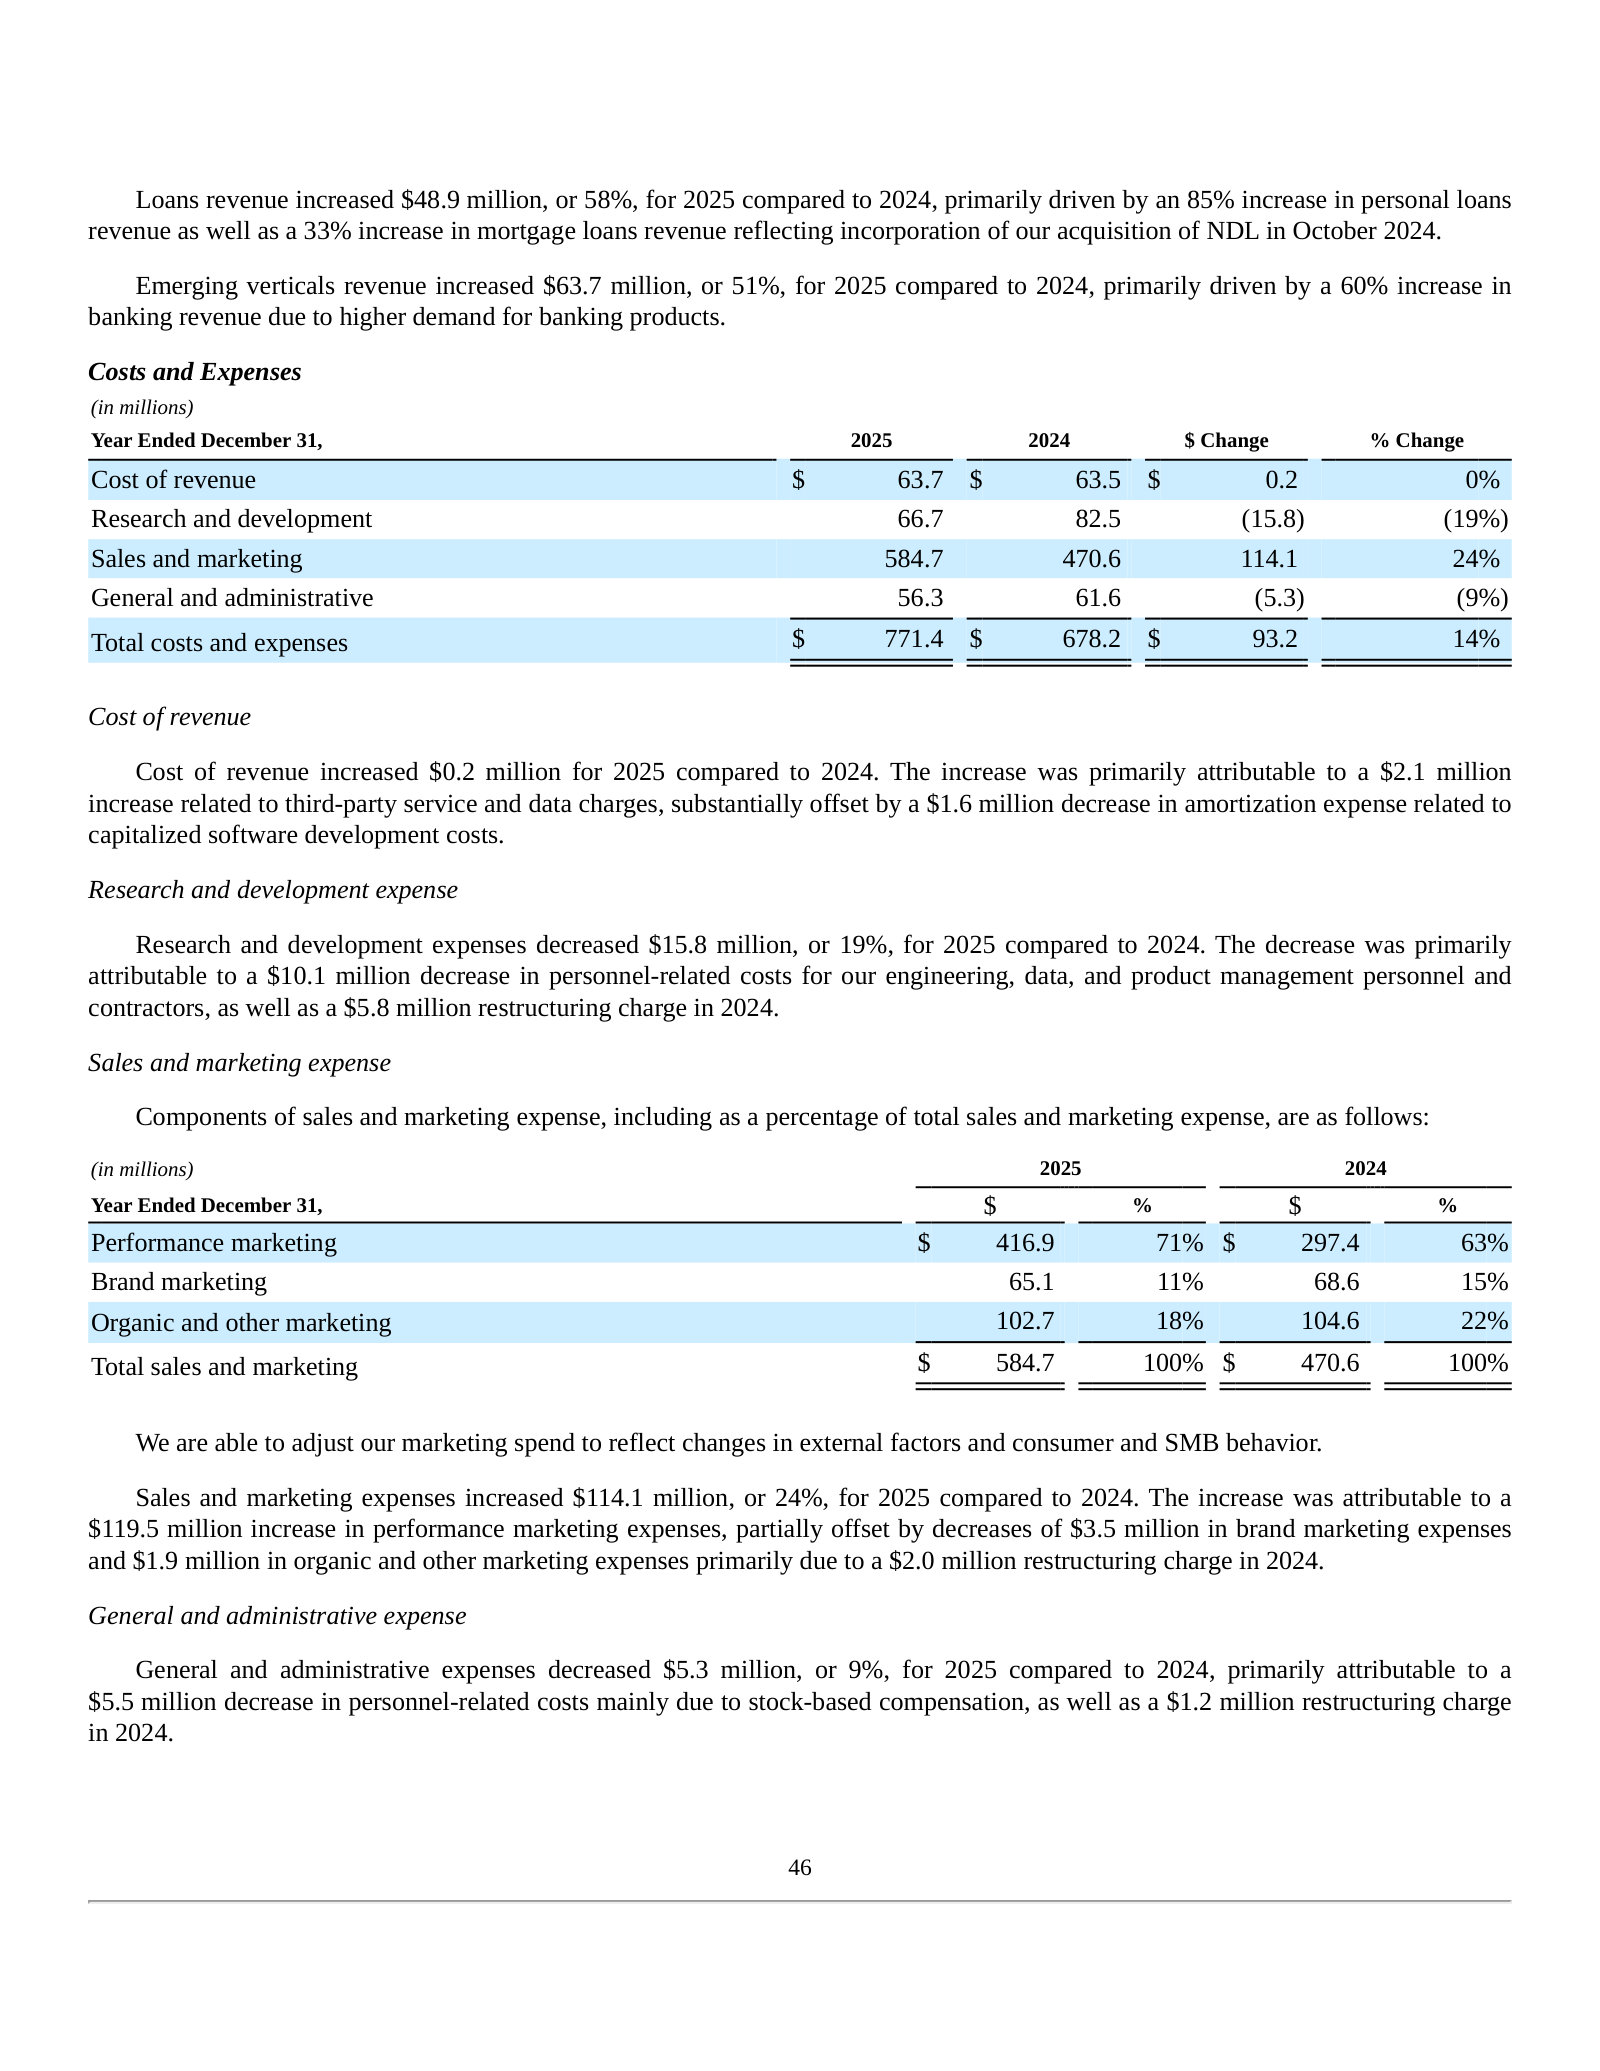
Where the year is decided: insurance carries the growth, and performance marketing consumes half of every revenue dollar.
Note 1. The Company and its Significant Accounting Policies — Revenue Recognition — p. 99 · Read the full section →
The policy that defines the model: revenue is booked on the match, before the partner approves, at a constrained estimate.
Note 2. Revenue — p. 104 · Read the full section →
The three-year disaggregation is the closest thing to segment data here, and it shows how fast the mix has moved.
NerdWallet, Inc. — FY2024 Annual Report (Form 10-K) — FY2024 (year ended December 31, 2024)
The pivot edition: Insurance is broken out as its own product category for the first time and the NDL mortgage brokerage is acquired. · Open the full document →
Item 1. Business — Recent Acquisition — p. 11 · Read the full section →
The deal that turned NerdWallet from a mortgage referrer into a licensed mortgage broker, described the year it happened.
Next Door Lending, acquired October 2024, licensed in 25 states at year-end.
In October 2024, we expanded our presence in the mortgage space with the acquisition of Next Door Lending LLC (NDL), a mortgage brokerage specializing in home purchase and refinancing solutions. […] Through NDL, we connect consumers with wholesale mortgage lenders, providing competitive rates and flexible terms. As of December 31, 2024, NDL is licensed to operate in 25 states, further strengthening our ability to serve homebuyers and homeowners nationwide.
p. 11 · Read in context →
More annual reports
NerdWallet, Inc. — FY2023 Annual Report (Form 10-K) — FY2023 (year ended December 31, 2023) · 145 pages · The last year before the insurance surge and the only net-loss year in the set; revenue $599.4M, net loss $11.8M. · Open →
NerdWallet, Inc. — FY2022 Annual Report (Form 10-K) — FY2022 (year ended December 31, 2022) · 146 pages · Peak credit cards: $210.3M of $538.9M revenue, before the category began its multi-year decline. · Open →
NerdWallet, Inc. — FY2021 Annual Report (Form 10-K) — FY2021 (year ended December 31, 2021) · 155 pages · First 10-K after the November 2021 IPO, with revenue reported in just three categories. · Open →
Competitors describe NerdWallet, Inc.'s market in their own filings and calls. These verified passages and visual pages show where their strategies meet, using source documents preserved in Sources.
LendingTree, Inc. (TREE)
The closest structural analogue to NerdWallet: a multi-vertical online comparison-shopping marketplace for mortgages, credit cards, personal and small business loans, deposits and insurance, monetised through match fees from financial partners. NerdWallet names LendingTree as an online competitor in its own 10-K.
LendingTree's 10-K positions its partner network breadth as the differentiator against narrower comparison-shopping marketplaces — the category NerdWallet also sits in.
LendingTree, Inc. (“LendingTree”, the “Company”, “we” or “us”) operates what we believe to be the leading online consumer platform that connects consumers with the choices they need to be confident in their financial decisions. Through multiple branded marketplaces, LendingTree empowers consumers to shop for financial services the same way they would shop for airline tickets or hotel stays, comparing multiple offers from a nationwide network of approximately 770 partners (which we refer to as “Network Partners”) in one simple search, and choose the option that best fits their financial needs. Services include mortgage loans, mortgage refinances, home equity loans and lines of credit, auto loans, credit cards, deposit accounts, personal loans, small business loans, insurance quotes and other related offerings. […] We believe our platform, consisting of a deep network of Network Partners across a broad array of financial products, differentiates us from other loan or insurance comparison-shopping marketplaces which may focus on fewer product offerings or partner with fewer service providers.
p. 5 · Read in context →
Asked about the GenAI search environment, LendingTree's CEO describes industry-wide SEO turbulence and says he would not want to run a business dependent on legacy organic search — the traffic model NerdWallet has historically relied on.
Scott Peyree — Chief Executive Officer: SEO has been very turbulent in Q3, with shifts in traffic impacting the entire financial services industry. I wouldn’t want to be a company heavily reliant on legacy SEO traffic. I think it's fair to say that the era of free-ranking high on Google is coming to an end. On the brighter side, paid search traffic, which we excel at, is continuing to perform well and grow. So yes, it's a turbulent market and a transitional period where participation in legacy SEO still matters, but it's critical to focus on developing content and data openness for LLMs and AIOs.
p. 5 · Read in context →
LendingTree's stated ambition is to be the top destination for shopping financial products, with a claim to the widest partner network among consumer finance shopping sites; the same remarks concede a legacy SEO decline it is offsetting with conversion gains.
Scott Peyree — President and Chief Executive Officer: Our marketing team has seen efficiency gains by utilizing AI-enabled technology to expedite design, ad testing, and funnel testing, resulting in a 17% year-over-year increase in overall conversions through our network in Q4, despite the challenges posed by legacy SEO decline. Our company’s guiding principle remains to be the top destination for shopping for financial products, and all our long-term initiatives are based on this goal. LendingTree has the widest network of financial partners compared to any consumer finance shopping site, enabling us to attract millions of visitors seeking the best deals.
p. 2 · Read in context →
Intuit Inc. (Credit Karma) (INTU)
Its Credit Karma segment is the consumer personal-finance platform NerdWallet names first among online competitors: free credit scores and monitoring paired with personalised credit card, loan and insurance recommendations monetised through financial-institution partners. Exhibits below are drawn only from the Credit Karma / consumer platform discussion.
Intuit's stated view that Credit Karma took share of member originations in the two product categories that also anchor NerdWallet's revenue — personal loans and credit cards.
Sasan K. Goodarzi — Chief Executive Officer: Credit Karma had a strong quarter. In fiscal year 2025, we saw several point increases in share of member originations for personal loans and credit cards. We believe share gains continued in Q1 as members and partners find value in our platform. These strong results and the introduction of significant innovation with Done For You experiences, AI-powered local expertise, and faster access to money show the power of one consumer platform.
p. 1 · Read in context →
Credit Karma's stated engaged-user base and cross-sell logic, answering an analyst on the durability of its share gains.
Sasan K. Goodarzi — Chief Executive Officer: Credit Karma is working because of all the innovation that we've done customer back and the integration with TurboTax. So if you really think about the 45 million monthly active users, the fact that they engage more than five times a month, and the fact that we now can help them with so many things more, compared to when we first bought Credit Karma when the member has the opportunity to understand what to do with their debt to get access to financial products like credit cards, personal loans, insurance.
p. 10 · Read in context →
QuinStreet, Inc. (QNST)
A performance-marketing company whose financial services vertical spans the same product set NerdWallet monetises — auto insurance, credit cards, personal loans and banking — and which competes for the same client marketing budgets and the same high-intent consumer traffic.
QuinStreet's argument for why AI does not disintermediate performance marketing — that the risk sits with businesses doing simple aggregation or intermediation of commodity data and products, not with holders of proprietary data and client integrations.
Doug Valenti — Chief Executive Officer: Commodity data, commodity products, then they are certainly at risk from AI. But that is not what most successful software companies broadly define or certainly not what QuinStreet is or does. We at QuinStreet have literally billions of dollars of proprietary data. We have spent billions of dollars generating that data through media campaigns that are extraordinarily complex with permutations into the billions. […] We have proprietary integrations and access to data and that to that data that allows to continuously generate more of it, refresh it, and build on it. And we have proprietary technologies, including AI since 2008, as I mentioned.
p. 3 · Read in context →
MediaAlpha, Inc. (MAX)
The largest insurance customer-acquisition marketplace, sitting on the demand side of the vertical that has become NerdWallet's biggest revenue driver. Financial comparison websites are the 'supply partners' whose traffic MediaAlpha monetises, so its disclosures size and describe the pool NerdWallet's insurance revenue is drawn from.
MediaAlpha's 10-K sizing of the insurance advertising market that funds the insurance vertical NerdWallet also serves.
Insurance is one of the largest industries in the United States, with attractive growth characteristics and market fundamentals. Insurance companies wrote over $3 trillion in premiums in 2024, growing at a 10% CAGR from 2018, according to S&P Global Market Intelligence. Demand for insurance products is stable, due to, in many instances, coverage being mandated by law (for example, auto insurance) or lenders (for example, homeowners insurance) or federally subsidized (for example, Medicare Advantage plans). The insurance industry as a whole is highly competitive and invests heavily in customer acquisition. According to William Blair, advertising spend by P&C insurance carriers in the U.S. is expected to reach approximately $14 billion in 2026, growing at a 10% CAGR from 2024 levels. We expect digital insurance advertising spend to grow at double digit rates annually over the next few years.
p. 13 · Read in context →
MediaAlpha's stated carrier penetration and referral volume — the scale benchmark in insurance customer acquisition.
For the year ended December 31, 2025, of the top 20 largest auto insurance carriers by customer acquisition spend in 2024, according to Dowling & Partners’ Advertising study, 16 were Demand Partners on our platform. Of these carriers, half were also Supply Partners in our ecosystem. During 2025, consumers shopping for insurance products through the websites of our diversified group of Supply Partners and our proprietary websites drove an average of 11.8 million Consumer Referrals on our platform each month.
p. 12 · Read in context →
Answering an analyst on how LLMs reshape insurance shopping, MediaAlpha's CEO gives a read on how much traffic its comparison-site supply partners — the peer set NerdWallet belongs to — are currently sourcing from LLMs, and flags that not all of them will adapt.
Steve Yi — Chief Executive Officer: I see either possibilities happening. I think, we think it's more likely that it's more of the latter, that the LLMs become a traffic source for most of our existing supply partners. I mean, certainly, some of our supply partners may not make the adjustment and are not able to acquire traffic in an efficient way from the LLMs. But once the LLMs layer on an advertising model, we think that could be a tremendous tailwind for our supply partners as that introduces an incremental advertising traffic acquisition source for them. […] I think anecdotally, our supply partners are telling us that somewhere in the mid- to high single digits of their traffic is coming from the LLMs, and this is in the early stages. I think as you've seen a couple of our supply partners have introduced apps for the LLMs.
p. 3 · Read in context →
EverQuote, Inc. (EVER)
A pure-play online insurance marketplace competing for the same insurer advertising budgets and the same insurance-shopping consumers, in the vertical that now drives most of NerdWallet's revenue growth. Its 10-K places 'finance and credit savings sites' — NerdWallet's category — in its competitive set.
EverQuote's 10-K sizing of P&C insurance distribution spend, including the digital slice that online marketplaces compete for.
P&C insurance is one of the largest segments of the United States economy and is highly fragmented with over 2,500 insurance carriers and over 100,000 insurance agencies, which collectively issued policies representing over $1 trillion in premiums in 2024. To capture new policies and retain their existing customers, U.S. P&C insurance carriers spent $129 billion in 2024 on marketing and distribution. […] Due to these challenges, insurance providers are seeking more efficient ways to connect with consumers, and as a result the internet has become increasingly influential in consumer insurance shopping, and $8 billion of 2024 insurance carriers’ marketing spend was on digital advertising.
p. 5 · Read in context →
EverQuote's 10-K competitive set for consumer traffic includes 'finance and credit savings sites', the category NerdWallet occupies.
Competition for consumers. The competition for consumer traffic and advertising space online is broad and diverse. Our competitors offer various marketplaces, products and services that compete with us. Some of these competitors include internet search engines and social media platforms; brand advertisers and brand agencies across a spectrum of industries; sites operated by individual insurance providers; finance and credit savings sites; insurance lead-generation, affiliate and aggregator networks; and marketing services providers for insurers and general marketing services providers. We believe we compete favorably in attracting insurance shoppers due to our superior data assets, consumer acquisition technology, team and data sciences management infrastructure.
p. 11 · Read in context →
Asked about rivals launching apps inside ChatGPT, EverQuote's CEO gives his read on how little traffic those integrations currently carry, and why paid advertising inside LLMs matters more to him than app placement.
Jayme Mendal — Chief Executive Officer: Regarding LLMs and app integrations, I would put that under the umbrella of technical integrations. We've been testing in these platforms for a while and have built several apps. We have not pushed anything to production yet. There are a number of apps in the insurance category in ChatGPT; many are similar — they take a web form experience and apply a lightweight conversational front end before spinning the consumer back to a web-based quoting and binding experience. There's a lot of friction to actually access these apps — you need to install or grant permissions — so our sense is very little actual traffic is flowing through those right now. […] One is paid advertising — ChatGPT and other LLM platforms opening up to paid ads. We're among the largest paid advertisers in insurance.
p. 4 · Read in context →
Zillow Group, Inc. (ZG)
Named by NerdWallet as an online marketplace competitor. The overlap is the mortgage funnel: Zillow runs both a lender marketplace and its own direct originator, the same dual structure NerdWallet created when it added the NDL mortgage brokerage alongside its mortgage comparison marketplace. Exhibits below cover the mortgage and consumer-traffic discussion only, not rentals or agent software.
Zillow's 10-K describes the same two-track mortgage model NerdWallet now runs — a lender marketplace alongside a directly owned originator.
For Borrowers. We provide buyers with multiple ways to pursue mortgage financing for their transaction. We provide the option to finance directly with Zillow Home Loans or to connect with our mortgage partners through our mortgage marketplace for both purchase and refinance opportunities. Zillow Home Loans, which is currently available in 49 states and the District of Columbia, originates mortgage loans and then generally sells the loans on the secondary market. Throughout 2025, Zillow Home Loans had double digit customer adoption rates across our Enhanced Markets.
p. 9 · Read in context →
More peer documents
LendingTree Q1 FY2026 earnings call — Q1 FY2026 · 5 pages · CEO describes rebuilding the homepage away from an SEO/lead-gen orientation toward branded content designed to win organic visibility in LLMs — the playbook a search-dependent marketplace runs when free ranking erodes. · Open →
LendingTree Q2 FY2025 earnings call — Q2 FY2025 · 5 pages · Management frames GenAI as an opportunity rather than a risk, citing measurable inbound traffic from ChatGPT and visibility in AI overviews — an early datapoint on LLM referral quality for financial marketplaces. · Open →
Intuit FY2025 Form 10-K — FY2025 · 160 pages · Full Credit Karma segment description — including the Lightbox pre-approval platform for lenders — plus Intuit's competition discussion and the risk factors on partner willingness to keep offering products on the platform. · Open →
Intuit Q3 FY2026 earnings call — Q3 FY2026 · 11 pages · Credit Karma revenue growth broken down by product (personal loans, auto insurance, home loans) and the claim that combined TurboTax + Credit Karma users carry roughly 30% higher ARPU — the cross-sell economics NerdWallet has no equivalent to. · Open →
QuinStreet Q1 FY2026 earnings call — Q1 FY2026 · 6 pages · CEO claims QuinStreet is less than 10% penetrated in its addressable footprint and gives revenue splits across auto insurance versus personal loans, credit cards and banking — a vertical-by-vertical read on the same client budgets. · Open →
MediaAlpha Q1 FY2026 earnings call — Q1 FY2026 · 5 pages · CEO cites an estimated 3x scale advantage in the open marketplace and welcomes a major LLM's shift toward advertising monetisation as a potential accelerant to referral traffic for its publisher partners. · Open →
EverQuote Q2 FY2025 earnings call — Q2 FY2025 · 8 pages · CEO details where competitive pressure for insurance traffic is most intense — industry-specific search versus more stable social and video channels — and how carriers entering the broader ad market raises acquisition costs for everyone. · Open →
Source: S&P Capital IQ consensus via Xpressfeed · Generated 2026-07-27.
Every normalized EPS number on this tape comes from a single analyst
Because normalized EPS carries one estimate everywhere, its surprises run from -228% to +381% and its revisions swing in double digits — that is one broker's model, not a consensus. Coverage also thins fast beyond FY2027: revenue drops to three estimates in FY2028, and FY2029 has a single analyst on EBITDA, GAAP EPS and net income. GAAP EPS, with five to six contributors through FY2027, is the better-supported earnings line here.
FY2027 EPS up 18% over 180 days while revenue edges lower; FY2028 EPS cut 10% in 90 days
The FY2027 upgrade is entirely older than 90 days — the consensus has not moved in the last month. Both normalized EPS lines carry a single contributing analyst, so read the size of these swings with care.
Currency: USD · Scale: money in millions, absolute · Point-in-time consensus; Δ90d is Now versus 90d.
| Metric | FY | 180d | 90d | 30d | Now | Δ90d |
|---|---|---|---|---|---|---|
| EPS (normalized) | FY2027 | $1.75 | $2.06 | $2.06 | $2.06 | -0.3% |
| EPS (normalized) | FY2028 | — | $2.58 | $2.31 | $2.31 | -10.4% |
| Revenue | FY2027 | $945.50m | $959.31m | $939.81m | $939.81m | -2.0% |
| Revenue | FY2028 | $952.10m | $1.01bn | $993.95m | $993.95m | -1.5% |
Revenue beat consensus in six of the last eight quarters; the latest print missed by 2.4%
The beats were sizeable — four of them above 9% — while both misses came in under 5%. FY2026 Q1 fell short on revenue and normalized EPS together.
Current sequences by metric: Revenue: 1 consecutive miss; EPS (normalized): 2 consecutive misses.
Currency: USD · Scale: money in millions, absolute · Consensus is captured before each actual first became effective.
| Quarter | Metric | Consensus | Actual | Surprise | Outcome |
|---|---|---|---|---|---|
| Q1 FY2026 | Revenue | $227.60m | $222.20m | -2.4% | Miss |
| Q1 FY2026 | EPS (normalized) | $0.42 | $0.31 | -25.2% | Miss |
| Q4 FY2025 | Revenue | $211.37m | $225.40m | +6.6% | Beat |
| Q4 FY2025 | EPS (normalized) | $0.29 | $0.15 | -48.7% | Miss |
| Q3 FY2025 | Revenue | $192.98m | $215.10m | +11.5% | Beat |
| Q3 FY2025 | EPS (normalized) | $0.32 | $0.35 | +10.6% | Beat |
| Q2 FY2025 | Revenue | $195.32m | $186.90m | -4.3% | Miss |
| Q2 FY2025 | EPS (normalized) | $0.26 | $0.13 | -49.5% | Miss |
| Q1 FY2025 | Revenue | $189.92m | $209.20m | +10.2% | Beat |
| Q1 FY2025 | EPS (normalized) | $0.01 | $0.02 | +44.4% | Beat |
| Q4 FY2024 | Revenue | $168.34m | $183.80m | +9.2% | Beat |
| Q4 FY2024 | EPS (normalized) | $0.11 | $0.54 | +380.8% | Beat |
| Q3 FY2024 | Revenue | $168.34m | $191.30m | +13.6% | Beat |
| Q3 FY2024 | EPS (normalized) | $0.22 | $0.04 | -80.0% | Miss |
| Q2 FY2024 | Revenue | $149.93m | $150.60m | +0.4% | Beat |
| Q2 FY2024 | EPS (normalized) | $0.08 | -$0.10 | -228.3% | Miss |
EBITDA up 12% in FY2027 while free cash flow falls 70% — earnings and cash pull apart
Gross margin holds above 93% from FY2026 onward while EBITDA dips in FY2026 before recovering. The free cash flow row carries no analyst count in this feed, unlike the revenue, EBITDA and GAAP EPS rows beside it.
Currency: USD · Scale: money in millions, absolute · YoY uses the prior fiscal year from the feed; analyst count and range use the first displayed period.
| Metric | FY2025A | FY2026E | FY2027E | FY2028E | YoY | Analysts | Low / high |
|---|---|---|---|---|---|---|---|
| Revenue | $822.93m | $883.87m | $939.81m | $993.95m | — | 6 | $821.65m / $824.75m |
| EBITDA | $143.30m | $142.62m | $160.22m | $168.43m | — | 4 | $141.40m / $145.00m |
| EPS (GAAP) | $0.63 | $0.83 | $0.96 | $0.95 | — | 6 | $0.61 / $0.66 |
| Gross margin | 91.9% | 93.8% | 94.1% | 93.6% | — | — | — |
| Free cash flow | $156.70m | $131.60m | $39.80m | $90.40m | — | — | — |
Five analysts put FY2027 EBITDA anywhere from 138.5 to 187.6 — a spread near a third of the mean
The FY2027 revenue range is about 8% of the mean against 31% for EBITDA — the argument is over profitability, not demand. FY2028 revenue looks tighter partly because only three analysts remain on it.
Currency: USD · Scale: money in millions, absolute · Spread/mean is absolute high-low divided by absolute mean.
| Metric | Period | Mean | Low–high | Spread/mean | Analysts |
|---|---|---|---|---|---|
| EBITDA | FY2027E | $160.22m | $138.50m–$187.59m | 30.6% | 5 |
| Net income (GAAP) | FY2027E | $67.93m | $60.40m–$75.20m | 21.8% | 5 |
| EPS (GAAP) | FY2027E | $0.96 | $0.84–$1.04 | 20.7% | 5 |
| Revenue | FY2028E | $993.95m | $960.80m–$1.03bn | 7.3% | 3 |
Five targets span 9 to 15 around a mean of 12; four buys against one hold and one sell
Currency: USD · Scale: money in millions, absolute · Analyst counts shown explicitly.
| Street view | Reading | Analysts |
|---|---|---|
| Recommendation mix | Buy 4, Outperform 0, Hold 1, Underperform 0, Sell 1 | 6 |
| Consensus score | 2.00 | 6 |
| Target price | mean $12.00; median $12.00; high $15.00; low $9.00 | 5 |
Visible Alpha broker models via S&P Xpressfeed · 6 brokers · 266 line items · freshest revision 2026-06-11.
The street models NerdWallet as a mix shift rather than a growth story: total revenue compounds at a mid-to-high single-digit rate while credit cards shrink and loans, insurance and the other emerging verticals absorb the gap. Revenue is the tightest line in the feed; the disagreement sits in marketing spend, free cash flow and how large an audience the models even assume. Growth is modeled to come from revenue per user rather than from more users, and part of the FY-2026 per-share step is a falling share count that later years reverse. Coverage is shallow, with six brokers at most and the vertical detail resting on three.
Loans overtake credit cards — the vertical mix, not the top line, is what moves
Insurance stays the largest single vertical throughout, but the visible change is credit cards, modeled lower in every forecast year while loans move from below credit cards to roughly twice their size by FY-2027. Total revenue growth is steady either way, so the earnings case turns on which vertical carries the mix. From FY-2026 these splits rest on three brokers, and the FY-2028 column on one.
| Line | FY-2025A | FY-2026E | FY-2027E | FY-2028E | YoY | Brokers |
|---|---|---|---|---|---|---|
| Total | — | — | — | — | — | — |
| Revenue | $822.92m | $883.87m | $939.82m | $993.93m | +7.4% | 6 |
| Verticals | — | — | — | — | — | — |
| Revenue - Credit cards | $137.66m | $100.51m | $93.40m | $88.05m | -27.0% | 6 |
| Revenue - Loans | $121.04m | $166.42m | $188.64m | $174.52m | +37.5% | 6 |
| Revenue - Other verticals | $564.22m | $617.09m | $659.70m | $698.19m | +9.4% | 6 |
| Within other verticals | — | — | — | — | — | — |
| Total revenue - Emerging verticals | $461.77m | $527.27m | $569.50m | $609.94m | +14.2% | 6 |
| Revenue - Insurance | $275.19m | $298.25m | $317.90m | $308.77m | +8.4% | 6 |
| Revenue - Emerging vertical excl insurance | $186.58m | $229.02m | $251.61m | $301.16m | +22.7% | 6 |
| Total revenue - SMB | $102.45m | $92.28m | $94.24m | $97.91m | -9.9% | 6 |
Brokers converge on FY-2027 revenue and split on what it converts into
Free cash flow and marketing spend are the same argument from either end — how much NerdWallet has to spend to hold the top line — and they drive most of the FY-2027 earnings range. The audience row rests on four brokers and spans a range that covers both contraction and growth against FY-2025.
| Line | Period | Median | Q1–Q3 | Min–max | Brokers |
|---|---|---|---|---|---|
| Revenue | FY-2027E | $933.34m | $917.21m–$960.65m | $906.58m–$984.04m | 6 |
| Free cash flow (FCF) | FY-2027E | $109.89m | $90.56m–$122.08m | $39.84m–$143.61m | 6 |
| Sales and marketing | FY-2027E | $638.61m | $630.97m–$667.98m | $626.48m–$698.91m | 5 |
| Adjusted EBITDA | FY-2027E | $157.26m | $154.10m–$159.82m | $138.47m–$187.59m | 6 |
| Monthly unique user (MUU)(M#) | FY-2027E | 22.22m Number | 20.08m Number–22.90m Number | 15.07m Number–23.52m Number | 4 |
Growth is priced, not trafficked: revenue per user rises while the audience does not
Revenue per monthly unique user rises in every forecast year, while brokers do not agree the audience grows at all. Marketing dollars keep climbing against that flat user base, and the leverage instead comes from opex falling as a share of sales. The two user lines rest on four to five brokers, thinner than the P&L.
| Line | FY-2025A | FY-2026E | FY-2027E | FY-2028E | YoY | Brokers |
|---|---|---|---|---|---|---|
| Audience | — | — | — | — | — | — |
| Monthly unique user (MUU)(M#) | 20.88m Number | 20.16m Number | 20.76m Number | 19.60m Number | -3.5% | 6 |
| Monetization | — | — | — | — | — | — |
| Revenue per MUU (monthly)($) | $3.27 | $3.39 | $3.54 | $3.68 | +3.8% | 6 |
| Operating leverage | — | — | — | — | — | — |
| Sales and marketing | $568.36m | $621.17m | $652.59m | $673.98m | +9.3% | 6 |
| OpEx / Sales(%) | 92.6% | 91.7% | 90.1% | 89.0% | -0.9pt | 6 |
| Operating margin(%) | 7.4% | 8.3% | 9.9% | 11.0% | +0.9pt | 6 |
Per-share math does part of the work: the diluted count drops in FY-2026, then climbs back
Revenue per share grows far ahead of revenue in FY-2026 and behind it in FY-2027; the difference is the diluted share count, taken down in FY-2026 and back up through FY-2028. Free cash flow per share is the widest line here and the one to stress-test, since it carries the same dispersion as the cash-conversion debate above.
| Line | FY-2025A | FY-2026E | FY-2027E | FY-2028E | YoY | Brokers |
|---|---|---|---|---|---|---|
| Shares - Diluted(M#) | 76.68m Number | 69.57m Number | 70.77m Number | 73.89m Number | -9.3% | 6 |
| Revenue per share($) | $10.73 | $12.71 | $13.29 | $13.45 | +18.4% | 6 |
| EPS - Diluted($) | $0.62 | $0.81 | $1.05 | $1.23 | +31.9% | 6 |
| Free cash flow (FCF) per share($) | $1.41 | $1.43 | $1.45 | $1.70 | +0.9% | 6 |
Six brokers at most, three on the vertical splits, one in FY-2028
The full model set peaks at six brokers. The vertical revenue lines carry six for FY-2025 but three for FY-2026 and FY-2027 and one for FY-2028, and the forward quarterly splits thin to a single broker — read those as one analyst's model, not consensus. Almost every forward-period revision date falls in May 2026.
Headline P&L consensus, momentum and beat/miss live in the CapIQ tab.
Source: S&P Capital IQ transcripts via Xpressfeed · latest indexed call 2026-05-06 · generated 2026-07-27.
Latest call digest
NerdWallet, Inc., Q1 2026 Earnings Call, May 06, 2026 · 2026-05-06T20:30:00
Q1 2026 call, May 6, 2026. Revenue of $222 million (up 6% year-over-year) landed below the $224–$232 million range guided in February, a gap management did not reconcile on the call. Profitability went the other way: non-GAAP operating income of $34 million came in above the $28–$32 million range, with adjusted EBITDA of $45 million, helped mainly by not repeating the prior-year Super Bowl ad. This is the first quarter under the simplified Consumer/SMB reporting: Consumer $198 million (up 10%), SMB $25 million (down 15%).
Prepared remarks versus Q&A. The prepared remarks led with opportunity — a "unique investment window" and a deliberate acceleration of vertical-integration spending — and folded the auto insurance shortfall in as one of two dynamics behind a lower guidance floor. Q&A pulled out the harder specifics: one large carrier "pulled back in March," NerdWallet carries heavy concentration across a few carriers and channels, the insurance build-out is a multi-quarter, slower ramp, and LLM referral traffic is "pretty much the same story as last quarter" and still small in revenue terms. Management declined to split the guidance cut between the insurance shortfall and the incremental investment.
Guidance actually stated. Q2 2026 revenue of $186–$202 million and non-GAAP operating income of $6–$14 million, with Q2 flagged as the seasonally softest quarter. Full-year 2026 non-GAAP operating income of $85–$110 million: the top end is reaffirmed, the floor is cut from the $95 million guided in February. Management framed the high end as offsetting the insurance weakness in the second half with fewer investment opportunities found, and the low end as neither happening. Full-year revenue growth is expected in the mid- to high single digits, with growth in every remaining quarter.
Notable for its thinness: only three analysts asked questions, the shortest Q&A in the twelve-call history reviewed.
Participant coverage from the latest call.
| Group | Participants | Count |
|---|---|---|
| Management | Operator; Robb Ferris — Vice President Of Finance, NerdWallet, Inc.; Tim Chen — Co-founder, Chairman & CEO, NerdWallet, Inc.; Jun Lee — Chief Financial Officer, NerdWallet, Inc. | 4 |
| Analysts | Miles Jakubiak — Research Analyst, KeyBanc Capital Markets Inc., Research Division; Michael Infante — Equity Analyst, Morgan Stanley, Research Division; Ralph Schackart — Partner & Research Analyst of Technology, Media and Communication, William Blair & Company L.L.C., Research Division | 3 |
Curated latest-call exchanges; one row per analyst topic.
| Analyst | Firm | Topic | What changed in Q&A |
|---|---|---|---|
| Miles Jakubiak | KeyBanc Capital Markets | What changed to justify accelerating vertical-integration investment | Chen answered structurally — falling cost of launching financial products, rising cost of distribution, entrepreneurs seeking NerdWallet's reach — rather than naming a specific trigger, a dollar figure, or where the incremental spend goes. |
| Michael Infante | Morgan Stanley | Splitting the full-year NGOI floor reduction between insurance and investment | Lee restated the scenarios behind each end of the range but did not quantify how much of the cut came from the carrier monetization shortfall versus the incremental investment. The question went unanswered as asked. |
| Michael Infante | Morgan Stanley | Return discipline on incremental investment amid the performance-marketing mix shift | Chen pointed to free cash flow yield versus market cap as an implied hurdle and to cheap internal build costs, but gave no threshold return or payback period. |
| Ralph Schackart | William Blair | Size and duration of the insurance build-out | Chen said multi-quarter and a slower ramp, covering both operations and business development for routing calls to independent and captive agents. No investment dollars were given. |
| Ralph Schackart | William Blair | LLM traffic and whether it cannibalizes organic search | Chen said the story is unchanged from last quarter: leading share of LLM citations in financial services, high conversion, but still a very small piece of revenue. He did not address the cannibalization half of the question. |
Theme tracker
Themes are curator-classified across supplied calls.
| Theme | Status | Quarters mentioned | Read-through |
|---|---|---|---|
| Organic search decline from AI Overviews and LLM answers | persisted | Q2 2024, Q3 2024, Q4 2024, Q1 2025, Q2 2025, Q3 2025, Q4 2025, Q1 2026 | Present in every call since Q2 2024 and still cited in Q1 2026 as the cause of SMB and credit card declines. The framing hardened over time: an early wave-and-rebaseline analogy in 2024, an expected lapping in 2025, and by Q4 2025 a flat description of steep declines offset by paid channels. |
| LLM referral traffic as a new acquisition channel | emerged | Q1 2025, Q2 2025, Q3 2025, Q4 2025, Q1 2026 | First raised as a channel in Q1 2025, then the dominant Q&A topic in Q3 and Q4 2025. Management has consistently claimed leading share of financial-services citations and higher conversion, and has just as consistently said it is immaterial to revenue. In Q1 2026 the update was that nothing had changed. |
| Vertical integration and bolt-on M&A | persisted | Q3 2024, Q4 2024, Q1 2025, Q2 2025, Q3 2025, Q4 2025, Q1 2026 | Runs from the Next Door Lending mortgage brokerage through the SMB loan concierge to NerdWallet Insurance Experts and the College Finance acquisition. Its role changed in Q1 2026: what had been an opportunistic use of surplus cash became a stated reason for lowering the profit floor. |
| Insurance as the swing vertical | persisted | Q2 2024, Q3 2024, Q4 2024, Q1 2025, Q2 2025, Q3 2025, Q4 2025, Q1 2026 | Discussed on every call, but the sign flipped. Triple-digit growth quarters through Q4 2024, then a platform-partner transition that caused a Q2 2025 revenue miss, then a carrier pullback in March 2026. Three of the last five calls have had an insurance-specific problem attached. |
| Monthly unique users (MUU) disclosure | dropped | Q2 2024, Q3 2024, Q4 2024, Q1 2025 | Management announced in Q4 2024 that it was retiring the metric and last discussed it in Q1 2025, when it guided to a return to year-over-year growth in early 2026 if search stability held. The metric has not appeared in the four calls since, so that expectation has never been revisited on a call. |
| NerdWallet+ membership | dropped | Q2 2024, Q3 2024, Q4 2024 | A named pillar of the registration and engagement strategy through 2024, with launches like the insurance assistant and a treasury bills account. Absent from the five calls since Q4 2024, with no stated wind-down or update either way. |
| Share repurchases as a standing capital-allocation lever | emerged | Q2 2025, Q3 2025, Q4 2025, Q1 2026 | Repurchases came up intermittently before (notably Q3 2024), but from Q2 2025 they became a fixed part of the CFO's framework alongside bolt-on M&A, with dollar amounts disclosed each quarter and $66 million bought back in Q1 2026. |
Guidance ledger
Quotes, calls, and speakers are source-verified; outcomes are curator-classified.
| Verbatim guidance | Call | Speaker | Curator outcome | Outcome note |
|---|---|---|---|---|
| “We expect to deliver third quarter revenue in the range of $172 million to $180 million, which at the midpoint would increase 15% versus prior year.” | NerdWallet, Inc., Q2 2024 Earnings Call, Jul 31, 2024 · 2024-07-31T20:30:00 | Lauren St. Waugh | kept | Q3 2024 revenue was $191 million, which the CFO described as above the guidance range. |
| “We expect to deliver fourth quarter revenue in the range of $164 million to $172 million, which at the midpoint would increase 26% versus prior year.” | NerdWallet, Inc., Q3 2024 Earnings Call, Oct 29, 2024 · 2024-10-29T20:30:00 | Lauren St. Waugh | kept | Q4 2024 revenue was $184 million, described on the next call as above the guidance range. |
| “we expect Q1 non-GAAP operating results in the range of a $3 million loss to breakeven” | NerdWallet, Inc., Q4 2024 Earnings Call, Feb 19, 2025 · 2025-02-19T21:30:00 | Lauren St. Waugh | kept | Q1 2025 non-GAAP operating income was $9.3 million, above the range. |
| “we now plan to deliver at least $80 million of non-GAAP operating income in 2026” | NerdWallet, Inc., Q4 2024 Earnings Call, Feb 19, 2025 · 2025-02-19T21:30:00 | Lauren St. Waugh | pending | 2026 is not complete. The Q1 2026 call guided full-year non-GAAP operating income to $85 million to $110 million, so the floor of the current range sits above this commitment. |
| “In Q2, we expect to deliver revenue in the range of $192 million to $200 million” | NerdWallet, Inc., Q1 2025 Earnings Call, May 06, 2025 · 2025-05-06T20:30:00 | Jun Lee | missed | Q2 2025 revenue was $187 million, below the range. Management attributed the shortfall to a temporary disruption to the insurance shopping funnel during a platform-partner transition. |
| “We now expect to generate full year 2025 non-GAAP operating income of approximately $55 million to $66 million.” | NerdWallet, Inc., Q1 2025 Earnings Call, May 06, 2025 · 2025-05-06T20:30:00 | Jun Lee | kept | Full year 2025 non-GAAP operating income was $96 million, well above this range, which was raised twice during the year. |
| “In Q3, we expect to deliver revenue in the range of $189 million to $197 million, which at the midpoint would be up 1% versus prior year.” | NerdWallet, Inc., Q2 2025 Earnings Call, Aug 07, 2025 · 2025-08-07T20:30:00 | Jun Lee | kept | Q3 2025 revenue was $215 million, above the range. |
| “We expect to generate full year 2025 non-GAAP operating income of $91 million to $95 million” | NerdWallet, Inc., Q3 2025 Earnings Call, Nov 06, 2025 · 2025-11-06T21:30:00 | Jun Lee | kept | Full year 2025 non-GAAP operating income was $96 million, just above the top of the range. |
| “We expect to deliver first quarter revenue in the range of $224 million to $232 million, up 9% year-over-year at the midpoint.” | NerdWallet, Inc., Q4 2025 Earnings Call, Feb 25, 2026 · 2026-02-25T21:30:00 | Jun Lee | missed | Q1 2026 revenue was $222 million, below the low end. Neither executive reconciled revenue to the range on the Q1 2026 call, though the non-GAAP operating income beat was called out explicitly. |
| “We expect to deliver second quarter revenue in the range of $186 million to $202 million, up 4% year-over-year at the midpoint.” | NerdWallet, Inc., Q1 2026 Earnings Call, May 06, 2026 · 2026-05-06T20:30:00 | Jun Lee | pending | Guided on the most recent call; Q2 2026 results are not in the supplied call history. |
| “For the full year, we're guiding to an NGOI expectation between $85 million and $110 million.” | NerdWallet, Inc., Q1 2026 Earnings Call, May 06, 2026 · 2026-05-06T20:30:00 | Jun Lee | pending | The top end is reaffirmed from the prior range; the floor was reduced from $95 million guided one quarter earlier. |
Q&A pressure map
Question counts and firms are curator tallies; analyst coverage shown above.
| Topic | Questions | Firms | Pressure / response |
|---|---|---|---|
| Organic search erosion, AI Overviews and LLM referral traffic | 15 | KeyBanc Capital Markets, Morgan Stanley, William Blair, Barclays, Citigroup, Truist Securities, Oppenheimer | The most persistent line of questioning across the last eight calls, raised by every covering firm in the set. Analysts moved from asking whether traffic would recover, to whether LLM traffic is incremental or cannibalistic, to what it costs in margin. Management has answered the qualitative parts fully and the quantitative parts not at all. |
| Insurance growth durability and concentration | 10 | Morgan Stanley, Barclays, Oppenheimer, Citigroup, Truist Securities, William Blair | Heavy pressure through 2024 and early 2025 on whether the hard-market surge was structural or a comp problem, then quiet for two calls, then back in Q1 2026 on how much the carrier build-out will cost. Management has repeatedly declined to name a steady-state growth rate. |
| Performance marketing mix and its effect on margin | 9 | KeyBanc Capital Markets, Morgan Stanley, Barclays, Oppenheimer, William Blair, Truist Securities | Analysts keep trying to size the margin drag from shifting revenue into paid channels. In Q4 2025 the CFO answered a direct request to quantify the drag by saying the company is not solving for a margin percentage and is not guiding to revenue channels — a plain redirect away from the question asked. |
| Vertical integration, M&A and capital deployment | 7 | KeyBanc Capital Markets, Oppenheimer, Morgan Stanley | Consistently framed as a strategy question until Q1 2026, when it became a returns question. The Morgan Stanley request to split the guidance cut between the insurance shortfall and the incremental investment drew a restatement of the scenarios rather than the split. |
| Brand marketing spend and its returns | 3 | Oppenheimer, William Blair | Raised sporadically, most sharply in Q3 2025 after an $8 million underspend. Chen has answered on process and creative strategy while stating outright that the company is coy about brand ROI for competitive reasons. |
Language shifts
Only language evidence verified against the referenced component is shown.
| Observation | Verbatim evidence | Call ID | Component |
|---|---|---|---|
| Guidance language split for the first time in this history: the top of the range affirmed while the floor is explicitly cut, with 'uncertainty' now attached to a named partner relationship rather than to macro conditions. | “taking a more conservative view on the lower end of the range to reflect 2 dynamics that are adding uncertainty to near-term results” | 1995600825 | 2 |
| Concentration is named as a vulnerability for the first time. Across 2024 and 2025 the insurance discussion was framed around share gains, funnel improvements and end-market tailwinds; here the same business is described in terms of its dependence on a few counterparties. | “we have a lot of concentration towards a few carriers currently and a few channels” | 1995600825 | 10 |
| Offense vocabulary appears in the same remarks that lower the profit floor. The investment case is stated as a window that is open now, which is a harder commitment to walk back than the opportunistic framing used in prior quarters. | “This is creating a unique investment window for NerdWallet.” | 1995600825 | 2 |
| The search headwind moved from something to be lapped to something conceded. 'Steep organic search declines' is the most direct description of the problem in the reviewed history, and it is stated as a fact about the year rather than a phase. | “we faced headwinds as consumers increasingly turn to AI overviews and LLMs over traditional search, resulting in steep organic search declines” | 1982607606 | 2 |
| For contrast, the 2024 framing treated search disruption as cyclical and self-correcting. That re-baselining language, and the accompanying expectation of a return to traffic growth, has not been repeated since the MUU disclosure was retired. | “we've generally seen a re-baselining after any major changes and then eventual growth from there as you lap the impact” | 1900390858 | 6 |
Twelve quarters of calls show a company that has stopped arguing with the search-channel problem and started paying to route around it, so far successfully on profit dollars. The open question the history raises is narrower than the AI debate: whether a business now leaning on paid distribution and self-funded vertical integration can hold its returns while its largest recent growth engine turns out to rest on a handful of insurance carriers.
Bought Traffic
NerdWallet matches consumers with financial products and is paid by the providers. Revenue reached $836.6 million in 2025, up 22% [1], producing $96.0 million of non-GAAP operating income [2] and $113.4 million of cash flow after all software spending [3]. Half of that revenue went to buying the traffic that produced it, a share that has risen every year since 2022 [4] [5]. The market values the whole company at roughly $584 million.
FY2025 Revenue ($M)
FY2025 Non-GAAP Op Income ($M)
FY2025 Cash Flow After Capex ($M)
Market Cap, 24 Jul 2026 ($M)
Sources: FY2025 Form 10-K, Consolidated Statements of Cash Flows and Non-GAAP reconciliation [6] [7]; share count from the Q1 2026 Form 10-Q balance sheet [8]; price as reported.
What the company is
NerdWallet runs a personal-finance website and app. Its editorial team publishes reviews, comparison tables and calculators covering credit cards, banking, insurance, loans, mortgages and investing; readers who arrive for the guidance are routed into marketplaces where they can compare and apply for products [9]. The company earns nothing from the reader. It is paid by the financial institution on the other side — per click, per lead, per completed application, or per funded loan, depending on the product [10]. It operates in the United States, Canada and the United Kingdom, and also owns regulated subsidiaries that broker mortgages and provide advisory services [11].
For most of its life the acquisition engine was free. NerdWallet ranked at the top of Google for the queries people type before they buy a financial product, and the audience arrived at no marginal cost: 19 million monthly unique users on average in 2021 [12], 23 million in 2023 [13]. The company has not disclosed the metric in either the 2024 or the 2025 Form 10-K.
Tim Chen, who co-founded the business in 2009, is Chairman and CEO. He and his affiliated trusts hold every one of the 31,685,652 Class B shares, which carry ten votes each, plus 1.5 million Class A shares — 50% of the economics and 90.72% of the vote [14]. The practical consequences run both ways. At $8.88 his stake is worth about $295 million, against total 2025 compensation of $1.54 million — a $700,000 salary and a performance bonus, with no stock or option award at all [15]. He is paid by the share price, not by the grant. Equally, no outside party can force a sale, a board change, or a change of strategy on him. NerdWallet is a "controlled company" under Nasdaq rules and is exempt from several governance requirements as a result [16].
The Class A shares listed on Nasdaq on 4 November 2021 and closed that first day at $28.30 [17]. They closed at $8.88 on 24 July 2026. A $100 investment at listing was worth about $49 at the end of 2025, against $151 for the Nasdaq Composite over the same period [18]. No dividend has ever been paid [19].
Source: daily closing prices through 24 July 2026, as reported; the 4 November 2021 first-day close of $28.30 is confirmed in the FY2025 Form 10-K stock performance graph [20].
Where the revenue comes from
The revenue mix has been rebuilt in two years. Credit cards — the highest-margin, most organic-search-dependent category, and the largest single line as recently as 2023 — has fallen from $209.7 million to $133.4 million, a 36% decline that the company attributes squarely to "continued pressures in organic search traffic" [21] [22]. Insurance has gone the other way, from $45.0 million in 2023 to $280.8 million in 2025, driven by auto insurers expanding acquisition budgets [23] [24]. Insurance was 8% of revenue in 2023 and 34% in 2025. It is also the one category paid per click rather than per completed application or per funded loan, and clicks are the unit of volume that can most readily be bought.
Source: FY2025 Form 10-K, Note 2 Revenue [25]. The 2023 split shown here is the company's restated presentation, which carves Insurance out of the Emerging verticals line originally reported for that year [26].
From the first quarter of 2026 the company stopped publishing this split. Revenue is now presented in two lines, Consumer and SMB, on the basis that it matches how management reviews the business [27]. Insurance, credit cards, loans and everything else consumer-facing now sit inside a single $198 million quarterly aggregate [28]. An outside analyst can no longer see the auto-insurance line separately, in the quarter management first flagged a problem with it.
The cost of the traffic
Management has been explicit about the cause. On the fourth-quarter 2025 call, Chen said that in 2025 "we faced headwinds as consumers increasingly turn to AI overviews and large language models over traditional search, resulting in steep organic search declines," and that growth in performance marketing, direct and non-search referral channels "more than offset the declines in organic search" [29]. The 10-K risk factors carry the same point in formal language: reliance on Google is a named dependency, and "the introduction and acceptance of AI-assisted technologies could further impact search engine relevance, causing declines in our ranking and decreased platform traffic" [30].
The cost of that substitution shows up in one line. Performance marketing — money paid to acquire visitors — was $168.4 million in 2022 and $416.9 million in 2025 [31] [32]. Subtracting it from revenue gives the money the business keeps before it pays for anything else — editorial, engineering, brand, overhead.
Source: derived from reported revenue and performance marketing expense, FY2023, FY2024 and FY2025 Forms 10-K [33] [34] [35].
Reported revenue compounded at 15.8% a year from 2022 to 2025. Revenue after the cost of buying traffic compounded at 4.2%. In 2024 that second figure went backwards, from $392.9 million to $390.2 million, while headline revenue rose 15%.
The first quarter of 2026 sharpened it. Revenue of $222.2 million was up 6% year over year; performance marketing of $121.7 million was up 25%, to 82% of all sales and marketing spend and 55% of revenue [36]. Revenue after that cost was $100.5 million against $111.6 million a year earlier — down 10% while the headline grew.
Sources: performance marketing expense, FY2025 Form 10-K [37]; FY2024 Form 10-K [38]; Q1 2026 Form 10-Q [39]; 2022 and 2023 revenue from the FY2023 Form 10-K [40]; percentages derived.
The strongest fact against reading this as deterioration is that total marketing intensity has barely moved. All sales and marketing was 67% of revenue in 2023, 70% in 2025, and 67% in the first quarter of 2026 [41] [42]. What has changed is the split inside marketing: brand spend fell from $106.3 million in 2022 to $65.1 million in 2025 [43] [44], and in the first quarter of 2026 non-performance marketing dropped from $62.1 million to $27.4 million, principally because the company did not repeat the prior year's Super Bowl advertisement [45] [46]. Measured after all sales and marketing rather than the performance line alone, the same arithmetic runs the other way: revenue net of total sales and marketing was $163.3 million in 2022 [47] and $251.9 million in 2025 [48], a compound rate of 15.5% over the identical 2022-2025 window in which the performance-marketing-only measure compounded at 4.2%; in the first quarter of 2026 it rose about 48%, from $49.5 million to $73.1 million [49], against the 10% decline measured after performance marketing alone. Performance marketing is also genuinely variable — the filings state plainly that "we are able to adjust our marketing spend to reflect changes in external factors and consumer behavior" [50]. A company that can turn the tap off is not trapped by it.
The reading that fits the evidence best is that both things are true: NerdWallet is converting bought traffic into profit today at a rate that is measurably improving, and the pool of free traffic underneath it is shrinking, so each incremental dollar of revenue costs more to source than the last. The trade is only worth making while the spread holds. A brand-spend cut that funds one year of operating leverage cannot fund the next.
What is left over
Whatever the mix, the profit is real cash. Non-GAAP operating income — stated after stock compensation and after deducting the $20.4 million of software the company capitalized rather than expensed, so nothing is added back twice — doubled to $96.0 million in 2025, with adjusted EBITDA of $145.0 million [51]. Operating cash flow was $131.6 million against $16.9 million of capitalized software — the cash paid in the year, per the cash-flow statement, rather than the $20.4 million capitalized on an accrual basis in the non-GAAP reconciliation above; Financials and Estimates uses the same cash basis — and $1.3 million of equipment, leaving $113.4 million of genuine free cash flow, up from $50.5 million in 2024 [52].
Two cautions on the reported profit. GAAP net income is distorted by tax: 2024's $30.4 million of net income sits on $5.0 million of pre-tax income, courtesy of a $25.4 million tax benefit, while 2025's $48.7 million follows a $19.5 million tax charge [53]. And the headline free cash flow figure quoted in some data feeds treats capitalized software as free — it is not; the $113.4 million above deducts it.
The balance sheet carries no funded debt. The $125 million revolver was undrawn at both year-ends, and the only borrowing is a $6.9 million warehouse line at the mortgage subsidiary, secured by the loans it funds [54]. Cash was $56.3 million at 31 March 2026, down from $98.3 million because the company spent $66 million on its own shares and $17 million on an acquisition in a single quarter [55] [56]. Repurchases have run $20.0 million in 2023, $80.1 million in 2024, $70.2 million in 2025 [57] and $66 million in the first quarter of 2026 — about $236 million, or 40% of today's market value, in nine quarters. Shares outstanding fell from 71.3 million to 65.8 million in the March quarter alone [58].
What the price implies
Sources: shares and cash from the Q1 2026 Form 10-Q [59]; non-GAAP operating income and free cash flow from the FY2025 Form 10-K [60] [61]; 2026 guidance from the Q1 2026 earnings call [62]; price as reported; multiples derived.
The derating is recent and dated. The shares closed at $11.20 on 6 May 2026, the day of the first-quarter release, and at $7.58 six sessions later — a 32% fall — before recovering to $8.88. Two things were said on that call. Chen disclosed that "monetization from one of our large partners started running below our expectations" in auto insurance, with a greater effect expected in the second quarter, and separately that the company would "be more aggressive in placing our long-term bets" [63]. The CFO then guided full-year non-GAAP operating income to $85 million to $110 million against $96.0 million delivered in 2025, holding the top of the range and cutting the bottom [64]. A company that had just doubled its operating profit guided the next year flat, and named single-partner concentration in its largest category as the reason.
The $528 million is not a distress price: there is no debt to default on, and the business generated $113 million of cash last year. At 4.7 times that figure it is a price consistent with 2025 having been the peak of a spread that closes.
The question this report exists to answer
The question is whether the profit NerdWallet earns on traffic it now buys is a durable return, or a narrowing spread left over from the free organic-search audience that built the business — and what an enterprise value near $528 million against $113 million of 2025 free cash flow implies about which.
Three things would settle it in the bull's favor: revenue after performance-marketing cost turning back up on a full-year basis; the insurance line proving to be a broad carrier-demand cycle rather than one partner's budget; and direct, non-search traffic growing enough to be worth disclosing again. Three would settle it the other way: revenue after traffic cost declining for a second consecutive year; operating leverage that comes only from cutting brand and fixed spend, which is a one-time source; and further reductions in what the company chooses to disclose.
Evidence in this chapter runs through the Q1 2026 Form 10-Q filed 6 May 2026 and market prices through 24 July 2026. Second-quarter 2026 results, guided to revenue of $186 million to $200 million and non-GAAP operating income of $6 million to $14 million [65], were not yet in the record.
Insurance Concentration
Almost all of NerdWallet's recent growth came from one vertical. Insurance was 8% of revenue in 2023 and 34% in 2025, and it supplied $235.8 million of the $237.2 million by which total revenue rose over those two years; revenue excluding insurance was $554.4 million in 2023 and $555.8 million in 2025, essentially flat. That growth rode an auto-insurance carrier-budget upcycle shared with pure-play peers, and the buyer base behind it is concentrated: one customer was 26% of 2025 revenue. In March 2026 one large carrier pulled back, and management expects a greater impact in the second quarter than in the first.
The vertical that carried the company
The revenue NerdWallet added between 2023 and 2025 is, to a rounding error, the insurance line. Insurance grew from $45.0 million to $280.8 million — a 6.2-fold increase [1]. Over the same span credit cards fell $76.3 million and the other three categories, netted together, moved by less than $80 million combined. The arithmetic leaves insurance responsible for 99% of the two-year revenue gain, and the rest of the business essentially flat.
Source: FY2025 Form 10-K, Note 2 Revenue disaggregation; "ex-insurance" derived by subtraction [2].
Insurance share of 2023–25 revenue growth
Insurance, share of 2025 revenue
Largest single customer, 2025 revenue
Insurance revenue, 2023 to 2025
Sources: FY2025 Form 10-K, Note 2 Revenue [3] and Concentrations of Credit Risk [4].
Insurance revenue is earned mostly per click, and covers consumer auto, life and pet products; the 2024–25 surge was specifically auto [5]. Management attributes the increase in each of the last two years to the same cause. Insurance rose $146.6 million, or 326%, in 2024 "primarily driven by a strong increase in auto insurance products revenue as carriers expanded budgets" [6], and a further $89.2 million, or 47%, in 2025 for the same reason [7]. The driver named in the filings is not a NerdWallet product improvement; it is carrier spending.
Borrowed from the cycle
That carrier spending moves in a cycle, and the two public companies that live entirely inside it document its shape. Auto-insurance carriers cut customer-acquisition budgets sharply in 2022 and 2023 — EverQuote attributes the pullback to "deteriorating underwriting performance, a rise in claims, inflation, and inadequate policy premiums" — then reopened them in 2024 and 2025 [8]. MediaAlpha frames the same pattern in industry terms: the property-and-casualty industry ran underwriting losses from 2021 through 2023 on automobile repair-cost inflation, "it has recovered strongly during 2024 and 2025" [9], and it describes the mechanism plainly — "soft" markets when loss ratios are low and carriers spend to acquire customers, "hard" markets when loss ratios are high and they cut acquisition spending until they can raise premiums [10].
Indexed to the 2023 trough, all three revenue lines move together: the incumbents fell into 2023 as NerdWallet's insurance line was still a rounding error, and all three then surged through 2024–25 on the same carrier-budget reopening.
Sources: NerdWallet insurance revenue, FY2025 10-K [11]; EverQuote total revenue [12] and MediaAlpha total revenue [13], reported financials FY2022–FY2025.
The peers' own accounts swung with the cycle. EverQuote went from a $51.3 million net loss in 2023 to $99.3 million of net income in 2025; MediaAlpha from a $40.4 million loss to $25.6 million of profit. NerdWallet's advantage is that it entered this upswing already profitable and far less exposed — insurance is 34% of its revenue, against roughly 90% for both pure-plays [14] [15]. But the growth that lifted NerdWallet's whole story came from the same external switch, and the incumbents warn it can flip: EverQuote notes that even after the recovery "a number of our top carrier customers remain below their peak historical spend" [16], and MediaAlpha flags a live 2026 trigger — new tariffs on imported automobiles and parts could raise claim costs and loss ratios and bring back the hard-market conditions that cut carrier spending [17].
The concentration inside the vertical
NerdWallet's exposure is narrower than the vertical's 34% share suggests, because a few buyers account for a large share of total revenue. The filings disclose a rising single-customer share: one customer was 26% of total revenue in 2025, up from a largest customer of 22% in 2024 and of 13% in 2023 [18]. At 26% of $836.6 million, that customer is about $217 million of revenue, against an insurance line of $280.8 million. The 10-K names no vertical for it, and the earlier disclosures argue against assuming one: the largest customer in 2023 was 13% of revenue, about $77.9 million, while the entire insurance line that year was $45.0 million, so the largest-customer series is not a pure insurance series. Management's remarks on the first-quarter 2026 call, quoted below, describe the concentration as sitting with a few carriers, which points toward insurance for the 2025 figure — an inference from the call rather than a disclosure in the filings.
Source: FY2025 Form 10-K, Concentrations of Credit Risk [19] and Note 2 Revenue [20].
Management confirmed the shape of the risk on the first-quarter 2026 call, and did so in the same breath as the first sign it was materializing. Chen: "One of our large carriers pulled back in March, and we have a lot of concentration towards a few carriers currently and a few channels," adding that even after growing the business several-fold "we are still a relatively new player in this market and have a pretty high concentration" [21]. The effect was not trivial: monetization from that partner "started running below our expectations, which impacted our Q1 results and is expected to have a greater impact in Q2" [22]. The company assumes in its guidance that it cannot offset the insurance weakness for the full year [23].
What management is doing about it
The response is a deliberate diversification of the insurance vertical, and it is being funded now. NerdWallet is deepening technology integrations with additional auto carriers, standing up phone-based referrals to agent-centric carriers, and building a branded agency, NerdWallet Insurance Experts, to add calls and leads alongside its core click product [24]. Chen describes this as a "more diversified and resilient base," and on the follow-up was explicit that it is a multi-quarter build with "a slower ramp" and real incremental cost [25]. That the company is spending to widen its carrier base is the clearest confirmation that the concentration is real; it is also the reason the low end of full-year operating-income guidance was cut.
The counter-case is that the backdrop still favors the vertical. Chen called the macro outlook for auto-insurance customer-acquisition spend "strong" [26], and MediaAlpha sees the industry's underwriting recovery as a multi-year tailwind [27]. If carrier budgets keep climbing and NerdWallet adds carriers faster than any one pulls back, the concentration falls while the vertical still grows. The evidence points the other way for now: one customer is already a quarter of the company, a large carrier cut spend in March, the disclosure that would let an outsider track carrier mix was retired from Q1 2026, and the diversification is a slow build against a fast risk. What would change the read is the single-customer ratio falling in the next two 10-Ks while insurance revenue holds — new carriers replacing old — rather than the vertical's growth and its concentration remaining the same number.
Financials and Estimates
Three years of statements show a business that inflected from loss to real cash generation: revenue $599.4m to $836.6m, GAAP operating income $3.6m to $65.2m, and cash-adjusted free cash flow $42.6m to $113.4m. The balance sheet carries no funded corporate debt and $98.3m of cash, which puts bankruptcy risk near zero. Consensus, thin on EPS, expects that revenue growth to slow to about 6% a year.
FY2025 Revenue ($M)
FY2025 Operating Income ($M)
FY2025 Net Income ($M)
FY2025 Free Cash Flow ($M)
Source: FY2025 Form 10-K, Consolidated Statements of Operations [1] and Consolidated Statements of Cash Flows [2]; free cash flow derived by subtracting capitalized software and property from operating cash flow.
The three-year income statement
Reported revenue grew 39.6% over two years, from $599.4m in 2023 to $836.6m in 2025 [3]. The step-change is below the top line: operating income moved from a rounding error ($3.6m, a 0.6% margin) to $65.2m (7.8%), because total costs and expenses rose 29.5% while revenue rose 39.6% [4]. Sales and marketing — where the bought-traffic cost sits (Bought Traffic) — is the largest line at $584.7m, up from $401.5m in 2023 [5].
Source: FY2025 and FY2024 Forms 10-K, Consolidated Statements of Operations [6].
The net-income line reads better than the business earned. In 2024, net income of $30.4m sat on pre-tax income of just $5.0m, lifted by a $25.4m income-tax benefit — a deferred-tax item, not operating profit [7]. In 2025 the tax line normalized to a $19.5m provision (a 28.6% effective rate), so the jump from $30.4m to $48.7m of net income understates the underlying improvement, while the two-year climb from a 2023 loss overstates it. Operating income — $3.6m, $9.4m, $65.2m — is the cleaner trace of the inflection.
Source: FY2025 Form 10-K, Consolidated Statements of Operations [8] and Non-GAAP Financial Measures [9]; FY2021–FY2022 from prior filings.
Earnings quality and cash conversion
The reported profit turns into cash, and then some. Operating cash flow was $72.1m, $71.8m, and $131.6m across 2023–2025; net income over the same span was −$11.8m, $30.4m, $48.7m [10]. Two mechanisms drive the gap, and both are worth naming rather than taking on faith. First, depreciation and amortization of $46.4m runs far above the $18.2m the company actually spent on software and equipment, because it is amortizing acquired intangibles and years of previously capitalized software that it is no longer matching with new spend [11]. Second, stock-based compensation of $28.6m is a real cost to shareholders that never leaves as cash.
The honest free-cash-flow number subtracts both software and equipment from operating cash flow: $131.6m − $16.9m − $1.3m = $113.4m in 2025, against $42.6m in 2023 [12]. The $16.9m is cash paid for capitalized software in the cash-flow statement; the same year's spend on an accrual basis is $20.4m, the figure the software note and the non-GAAP reconciliation both carry, so the two numbers are one outlay on two bases [13]. A headline that counts only the $1.3m of hard equipment and ignores the capitalized software would show $130.3m, $16.9m higher — the reason this chapter uses the lower figure.
Source: FY2025 Form 10-K, Consolidated Statements of Cash Flows [14]; free cash flow derived by subtracting capitalized software and property.
Two smaller quality signals point the same way. Stock-based compensation fell from $38.8m to $28.6m even as revenue rose 40%, so the dilution cost is shrinking against a larger business [15]. And receivables grew 8.6% (to $111.0m) against 21.7% revenue growth, so days-sales-outstanding fell from about 54 to 48 — cash is being collected faster, not parked in a growing receivable [16]. The one asterisk on cash quality is that the free-cash-flow tailwind partly depends on software capitalization continuing to fall ($28.8m in 2023 to $16.9m in 2025); a renewed build cycle would narrow the gap between operating and free cash flow [17].
The balance sheet: debt-free, net cash
For a reader who wants bankruptcy risk near zero, the balance sheet is the reassuring part of the file. At 31 December 2025 NerdWallet held $98.3m of cash against $86.6m of total liabilities and carried no funded corporate borrowing; total stockholders' equity was $374.5m and the current ratio was 3.45x [18]. The only borrowing on the sheet is a small, self-liquidating mortgage warehouse line, and the $125m revolver is undrawn (detailed in Bought Traffic).
Cash ($M)
Total Liabilities ($M)
Equity ($M)
Current Ratio
Source: FY2025 Form 10-K, Consolidated Balance Sheets [19].
Two qualifications keep this from being an asset play. Goodwill and intangibles of $145.0m are 31% of the $461.1m asset base, so tangible backing is thinner than the equity figure suggests, and the accumulated deficit of $188.1m reflects years of losses and buybacks funded from paid-in capital [20]. Net cash of roughly $91m at 31 December 2025 is about 16% of the market value — enough to remove solvency risk, not enough to make this a market-cap-near-net-cash situation; the margin of safety here is the cash the business throws off, not the cash already on the sheet. That balance drops intra-year: cash was $56.3m at 31 March 2026 [21], after $66m of buybacks and $17m for the College Finance acquisition in the quarter [22]. The two dates give two enterprise values, and the multiples below use the later one: netting the 31 March 2026 cash gives about $528m, while netting the 31 December 2025 net cash gives about $493m.
What the forward estimates show
Consensus expects the growth engine to shift down. On revenue — where six analysts contribute — the estimate is $888.6m for 2026 and $943.9m for 2027, each about 6.2% above the year before, against a three-year historical revenue CAGR of 15.8% derived from the reported top line [23]. Management's own framing matches: it guided to full-year 2026 revenue growth "in the mid- to high-single digits" and non-GAAP operating income of $85m to $110m, a range that brackets the $96.0m delivered in 2025 [24].
Source: FY2025 Form 10-K [25] for actuals; consensus estimates (six contributing analysts), as reported.
The earnings estimate needs a plainer health warning than the deceleration it shows. The EPS consensus is a single contributor — one analyst across every forward period in the data feed — so it is one view, not a crowd, and it has moved sharply. The 2026 figure was cut from $1.48 ninety days ago to $1.30 (−12%), tracking the low-end guidance reduction management tied to the auto-insurance partner pullback (Insurance Concentration); the 2027 figure was raised from $1.75 to $2.06 over the same window. Both sit well above the $0.64 of GAAP diluted EPS the company actually reported for 2025, which places them on an adjusted basis.
Source: consensus estimates as of late July 2026, as reported; revenue reflects six contributors, EPS a single contributor.
What the price pays for it
At the 24 July 2026 close of $8.88 the equity is worth about $584m and the enterprise value about $528m on the March-2026 cash basis, using the share count from Bought Traffic — 4.7x the $113.4m of 2025 free cash flow, 5.5x the $96.0m of non-GAAP operating income, 13.9x the $0.64 of GAAP diluted EPS [26], and about 6.8x the single-contributor 2026 adjusted estimate.
EV / FY2025 FCF
EV / FY2025 NGOI
P / GAAP EPS
P / FY2026E EPS
Source: derived from FY2025 Form 10-K financials [27] and the 24 July 2026 share price; enterprise value and share count per Bought Traffic.
Under 5x free cash flow for a debt-free business is a low multiple, and it rests on the $113.4m of 2025 free cash flow holding: consensus expects revenue growth to roughly halve, and the guided $85m to $110m of 2026 non-GAAP operating income brackets the $96.0m delivered in 2025. The reconciliation of that multiple against weaker and stronger cases, and the single published price target, are set out in Margin of Safety.
Search Disruption
The tailwind and the threat are the same force. Financial shopping keeps migrating online — NerdWallet's opportunity — but the free organic-search traffic that built its audience is eroding as Google's AI overviews and large language models answer money questions without a click. Management's language moved from "not much of an impact" in mid-2024 to "steep organic search declines" for full-year 2025 [1]. LLM referrals are a higher-converting but still tiny replacement channel.
The online shift, and who else is in the lane
The secular tailwind is genuine: consumers and small businesses increasingly research and buy financial products online, and NerdWallet is a scaled comparison marketplace positioned to capture that shift. Management frames the runway as long — the company is "still at an early stage" and has "only scratched the surface of our addressable market" [2].
The same migration draws well-capitalized competition. The field, and where NerdWallet stands in it, is the subject of Competitive Position. The point that belongs here is narrower: the largest party in that lane, Google, is also the single largest source of NerdWallet's traffic.
One gatekeeper, and how the filing language moved
Since its 2021 listing, NerdWallet has disclosed that it is "dependent on internet search engines, particularly Google, to direct traffic to our websites and refer new users to our platform" [3]. What has changed, in narrow and specific ways, is how the filing describes the AI threat to that channel.
The FY2021 10-K flagged Google dependence with no mention of AI [4]. The FY2022 10-K added a conditional line: "The introduction of AI-assisted technologies may impact the relevance of search engines… if we are not able to adapt our content strategy to a changing web search landscape" [5]. By FY2025 that conditional had tightened in two specific places — "may impact" became "could further impact," and "acceptance" was added to the introduction of the technology: "The introduction and acceptance of AI-assisted technologies could further impact search engine relevance, causing declines in our ranking and decreased platform traffic" [6]. What did not change is the acknowledgement that traffic has already been lost: FY2025's "Past changes have caused declines in traffic and user growth" [7] restates a line the FY2022 filing already carried on the same page as the conditional: "We have experienced declines in traffic and user growth as a result of these changes in the past" [8]. A distinct FY2025 risk factor now treats "generative and agentic AI technologies" as their own category of exposure [9]. The delta in the filing language is a handful of words. The sharper record of the change is in what management said on the calls.
From "not much of an impact" to "steep declines"
The earnings calls trace the same shift in real time, and faster than the annual filing. In mid-2024 Chen was dismissive of AI overviews, arguing they were "not much of an impact," noting that web visits to the leading consumer AI assistant "actually fell 12% month-over-month," and that Google was if anything gaining share [10]. One quarter later the tone changed: shopping traffic "took a turn for the worse" in August and September, and "the renewed push by search engines to incorporate their own answers directly into search results, like the AI overviews mentioned, is affecting us" [11].
Sources: quarterly earnings-call transcripts — Q2 2024 [12], Q3 2024 [13], Q4 2024 [14], Q1 2025 [15], Q2 2025 [16], Q3 2025 [17], Q4 2025 [18], Q1 2026 [19].
By the middle of 2025 the framing had settled. Organic search "remains quite challenging," AI overviews had rolled out to "a much larger range of queries," and — because those overviews answer educational questions on the results page without a click — monthly active users "have been affected more than revenue" [20]. That split matters: NerdWallet's less-commercial "learn" traffic is more exposed to AI answers than its high-intent "shop" traffic, which is why revenue has held up better than the audience metric. Summing the year, Chen described "steep organic search declines" driven by consumers turning to AI overviews and LLMs, and guided that organic search would "remain under pressure" [21].
The substitution, and where it leads
This erosion is the reason performance marketing — bought traffic — climbed to roughly half of revenue over the same window; the arithmetic sits in Bought Traffic. The free top-of-funnel that once fed the marketplace at near-zero marginal cost is being replaced by traffic the company pays for click by click. Whether that substitution is a temporary bridge or a permanent margin drag is most sensitive to the rate at which a new organic channel refills the funnel the old one is losing — and no disclosure sizes that rate.
A new organic channel, still small
There is a candidate, and management leans on it. NerdWallet says its trusted content has made it "the most cited source in our competitive set" in LLM answers [22] and that it is "dominant when it comes to LLM share in financial services or money questions" on third-party data [23]. The referral quality looks better than legacy search: "the conversion rates on that LLM referral traffic are much higher and growing rapidly" [24], and those users arrive with "significantly higher intent to transact" [25].
The honest limit is that the channel is not yet material. On the most recent call Chen placed it plainly: LLM referral traffic is "just a very small piece of our overall pie right now from a revenue perspective" [26]. The company discloses no figure to size it, so the replacement channel is real and qualitatively superior per click, but too small to weigh against the organic declines it is meant to offset.
Whether the marketplace layer is defensible
The deeper question is whether AI reaches past the traffic layer and disintermediates the marketplace itself. Management's answer rests on two frictions specific to financial services. The first is licensing and compliance: quoting insurance, credit, mortgages or investments requires licensed, deterministic, compliant outputs "not probabilistic answers," which any intermediary — human or agentic — must satisfy. The second is institutional buy-in: a two-sided marketplace only works if lenders and insurers choose to participate, and "an insurance company can refuse to quote an AI agent that is shopping around by inserting a multifactor authentication step" [27].
That is a coherent defense of the transaction layer, and it is management's, not an independent finding. The counter is that it protects the wrong step. The licensing moat guards the point of purchase, while the value NerdWallet actually captures begins upstream, at discovery — the same top-of-funnel that AI overviews are already thinning. If large model providers strike direct data or referral arrangements with financial institutions, the discovery step could be intermediated even where the regulated transaction cannot. The read that fits the evidence: the organic-search headwind is structural and confirmed by the company's own escalating language, the paid channel is covering it today at a real but bounded cost, and the LLM offset is promising but unproven at any scale that shows in revenue. What would move that read is a disclosed, material LLM-referral contribution — or a genuine stabilization in organic search, which management hoped for in early 2025 [28] and had walked back by year-end.
Watch item: the company reports LLM referrals as "dominant" in share and higher-converting, but "a very small piece" of revenue with no disclosed figure. A dollar or percentage size on that channel — or a stabilization in organic search — is what would show the bought-traffic substitution is temporary rather than permanent.
Competitive Position
NerdWallet competes in a fragmented, cyclical performance-marketing industry where one rival — Credit Karma — earns roughly 13% on a comparable fully-loaded basis at about 2.7 times NerdWallet's revenue, on an owned-login model NerdWallet does not have. The 37% margin Intuit reports for the Credit Karma segment is a contribution figure struck before $8,698 million of unallocated corporate costs; allocated pro-rata by segment operating income, Credit Karma's operating income is about $302 million on $2,263 million of revenue [1]. NerdWallet's own edge is narrower: brand and a spread of verticals kept it operating-profitable through the 2023 trough that pushed every pure-play peer into losses, but it spends about 50 cents of each revenue dollar on performance marketing — the bought traffic a moated business would own — inside a sales-and-marketing line that takes 70 cents [2].
The field it competes in
NerdWallet names its direct rivals plainly. Its online competitors are the marketplaces Bankrate, Credit Karma, LendingTree, and Zillow, alongside personal-finance content providers, the financial institutions that market their own products, and search engines and content aggregators [3]. Because it holds no exclusive relationships, the same lender or carrier can reach a customer through its own campaigns, through NerdWallet, or through any of those competitors — the disintermediation risk that sits underneath every click NerdWallet sells [4].
The company's own account of its advantage is qualitative: it competes favorably, it says, on the breadth and depth of its financial guidance, the trust it has built, and its brand, organic traffic, convenience and simplicity [5]. Two of those pillars are worth testing against the numbers, because one of them — organic traffic — is the asset the eroding free funnel is taking away (Search Disruption).
Scale and margin: what a real moat in this space looks like
The most useful benchmark is Credit Karma, the rival NerdWallet names and the one peer here with a durable franchise. As Intuit's segment, Credit Karma generated $2,263 million of revenue and $835 million of operating income in the fiscal year ended July 2025 — a 37% margin as Intuit reports the segment [6]. That 37% is a segment contribution margin rather than a fully-loaded one, and Intuit's own footnote on the cited page says so: the Credit Karma segment's costs exclude expenses recorded within unallocated corporate items. Those unallocated items came to $8,698 million against $13,621 million of total segment operating income, leaving $4,923 million of consolidated operating income on $18,831 million of revenue — a 26.1% margin for Intuit as a whole [7]. Allocating that corporate load pro-rata by segment operating income leaves Credit Karma with about $302 million, or 13.3% of its revenue. NerdWallet earned $65.2 million of operating income on $836.6 million of revenue in calendar 2025 — a 7.8% margin, fully loaded [8]. Like for like, the comparison is 13.3% against 7.8%, not 37% against 7.8% — the ranking holds, but the distance is roughly a third of what the reported segment figure implies. Credit Karma is a business doing the adjacent job — a logged-in personal-finance hub monetized by matching users to credit and lending products — at 2.7x the revenue and, on the allocated basis, about 4.6x the operating profit.
Sources: Credit Karma segment — Intuit FY2025 Form 10-K [9]; NerdWallet — FY2025 10-K [10]; LendingTree, MediaAlpha, EverQuote, QuinStreet — company filings, as reported.
Below Credit Karma, the field is a cluster of sub-scale, low-margin marketplaces. Confirmed from their own filings, each runs a version of NerdWallet's model: EverQuote and MediaAlpha are insurance customer-acquisition marketplaces, LendingTree spans loans and insurance, and QuinStreet is a performance-marketing network across financial and home-services verticals. Zillow, the fourth named rival, is a real-estate portal whose economics track the housing cycle rather than the lending-and-insurance one, so it is a poor margin comparator and is left out of the table. Among the genuine fintech-marketplace peers, NerdWallet's 7.8% operating margin sits mid-pack — ahead of MediaAlpha (2.0%) and a loss-making QuinStreet, roughly level with EverQuote (8.4%), and below only Credit Karma.
Margins are consolidated operating margins as reported, except Credit Karma: its 36.9% is Intuit's segment contribution margin, struck before unallocated corporate items, and allocated pro-rata it becomes about 13.3% — the like-for-like figure against NerdWallet's 7.8% [11]. Sources: as above; QuinStreet's latest feed year is the June-2024 fiscal year (its June-2025 year, not in the data, returned to profit), so its figure understates its current run-rate [12] [13].
The number that frames the moat question is what NerdWallet spends to bring traffic in. Sales and marketing ran to $584.7 million in 2025, or 69.9% of revenue, up from 67.0% in 2023 [14]. Performance marketing alone — the paid traffic line — was $416.9 million of that, or 49.8% of revenue [15]. A business with a durable audience keeps that ratio falling as it scales; NerdWallet's rose across 2023 to 2025 as paid acquisition replaced the free organic funnel.
What the 2023 trough showed
An advantage only counts if it survives a downturn. The auto-insurance advertising cycle supplied one: 2023 was the trough before carriers reopened their budgets (Insurance Concentration). At that trough, NerdWallet and Credit Karma were the only two names in this set to hold an operating profit. Every pure-play marketplace lost money at the operating line.
Sources: NerdWallet FY2023 income from operations $3.6M [16]; Credit Karma segment operating income $428M [17]; EverQuote, MediaAlpha, LendingTree, QuinStreet — company filings, as reported.
NerdWallet's $3.6 million of 2023 operating income is a thin cushion, but the direction is the point [18]. What kept it positive was breadth: in 2023 its credit-card vertical was near its peak while insurance was near its bottom, so the two cycles partly offset each other — the diversification a single-vertical marketplace like EverQuote or MediaAlpha structurally cannot have. Credit Karma's cushion came from the opposite source: scale and an owned, logged-in relationship that let it hold a 26% segment contribution margin, on the same pre-corporate-allocation basis, even in its own soft year [19].
Where the advantage actually resides
Reading the evidence together points to a narrow moat — real, but shallow, and resting on diversification and brand rather than pricing power or lock-in.
The case for it: NerdWallet out-earns the pure-play marketplaces across the cycle and was one of only two names to stay operating-profitable at the trough, which is what breadth plus brand buys. Brand recognition is, in the company's own words, the key differentiating factor between it and its competitors, and its multi-vertical footprint genuinely damps the single-vertical cyclicality that sank its peers [20].
The strongest fact against it: nothing in the numbers shows pricing power or customer lock-in. Sales and marketing ran at 69.9% of revenue in calendar 2025, up from 67.0% in 2023, and the ratio has since turned down — in the first quarter of 2026 it fell to 67.1% of revenue, from 76.3% a year earlier, on $149.1 million of spend against $222.2 million of revenue [21]. The fall came from the line the company can switch off: brand and other marketing was cut from $62.1 million to $27.4 million, while performance marketing rose from 46.7% to 54.8% of revenue [22]. A marketing budget that has to be re-spent on traffic each period is the signature of a business that rents its audience rather than owns it [23]. Two of the four pillars NerdWallet cites for its edge — organic traffic and, indirectly, the trust built on top of it — are exactly what the shift to AI and paid search is eroding [24]. And the moat has no exclusivity: the disintermediation clause means every advertiser is free to route around it [25]. Credit Karma is the standing proof of what NerdWallet lacks: an owned login that converts a one-time shopper into a returning, monetizable relationship, and the margin that comes with it — 13.3% once corporate costs are allocated, against NerdWallet's 7.8%, and 37% as Intuit reports the segment [26].
What would change the read: a sustained fall in sales-and-marketing intensity as revenue grows — evidence that an owned, logged-in audience is starting to carry acquisition (Owned Audience) — would move the moat from narrow toward established. A widening of the margin gap to Credit Karma, or NerdWallet slipping into the pure-play peers' loss-making pattern at the next cyclical trough, would argue the advantage is thinner than even a narrow reading allows.
Read: a narrow moat. NerdWallet out-earns the pure-play marketplaces and held a profit through the 2023 trough on brand and multi-vertical breadth, but it shows no pricing power or lock-in and spends about half of revenue on performance marketing inside a sales-and-marketing line of roughly 70% — while Credit Karma, on a comparable fully-loaded basis, earns about 13% at 2.7x the scale on the owned-login model NerdWallet lacks. Intuit reports that segment at 37%, before unallocated corporate costs.
Owned Audience
The complement to an eroding free funnel is an audience the company owns. NerdWallet's answer is registration: 25 million cumulative registered users at the end of 2024, each worth about five times a passing visitor by the company's own math [1], plus NerdWallet+, a paid membership. The direction is on-thesis. The evidence for its scale is thinner: a cumulative metric that only rises, a member count never disclosed, and — after mid-2025 — the registered-user number quietly retired.
Registering the visitor, keeping the relationship
The free organic funnel that built NerdWallet feeds the marketplace once, at the moment of a search. Registration is the attempt to convert that one-time visit into a relationship the company can return to on its own terms. The logged-in experience — what the company calls Personal Financial Management — lets a registered user link accounts and credit data so NerdWallet can analyze "first-party data, third-party data from financial account aggregators and credit reports" and push "contextual nudges" back to the user [2]. That relationship is one of NerdWallet's three stated growth pillars, "Registration and Data-Driven Engagement," whose purpose is to "drive repeat visits, collect data and provide users with unique insights" — and, the company has been converting visitors into registered users "since 2016" [3].
The economic claim behind the pillar is specific and, if durable, material. In its FY2024 10-K the company states that registered users "have a lifetime revenue value five times greater than our non-registered users and more than twice the transactions and sessions, on average" [4]. A registered user is worth returning to because they transact more often and can be re-engaged directly through the company's CRM — the closest thing NerdWallet has to a channel that does not have to be re-bought each quarter, and therefore the natural hedge against the organic-search decline traced in Search Disruption. The figure is management's own and unaudited; no split of revenue between registered and non-registered users is disclosed to test it.
The count, and where it stops
The registered base has grown steadily on the numbers the company chose to give. From the FY2024 10-K: 14 million registered users at the end of 2022, over 19 million at the end of 2023, 25 million at the end of 2024 [5] — a 79% rise across two years. The 2025 shareholder letters extended the line: over 26 million after the first quarter [6], over 28 million after the second, up 26% year over year [7].
Then the number stops. From the third quarter of 2025 onward the letters keep discussing the "registered user base" and the CRM work to "provide more personalized suggestions" to it [8] [9], but they stop quantifying it. The last cumulative figure the company disclosed was 28 million, in August 2025.
Sources: FY2024 10-K [10]; Q1 2025 [11], Q2 2025 [12], Q3 2025 [13] and Q1 2026 [14] shareholder letters.
Two features of the metric temper what the growth proves. First, it is cumulative: a registered user is counted once and never removed, so the line can only rise and reveals nothing about whether registered users stay active or lapse. That is a different quantity from the monthly-unique-users figure the company retired after 2023 — a monthly-active measure that can fall when the free funnel thins (traced in Bought Traffic). NerdWallet now leads with the stock that only climbs and no longer reports the flow that can decline. Second, both series went dark on a rising reading. Monthly unique users were last reported at 23 million for 2023 against 20 million for 2022, up 15% [15]; the registered base was last reported at 28 million in August 2025, up 26% year over year [16]. Neither number had turned down when it stopped, which is why the gap cuts both ways: it is not evidence of a decline, and it is the reason a decline — or continued compounding — cannot be sized from the outside. The January 2026 reporting change to Consumer and SMB segments may explain dropping several legacy metrics at once; either way, the reader can no longer see whether registration kept pace.
NerdWallet+, a loyalty program before a profit center
The sharpest expression of the owned-audience strategy is NerdWallet+, a paid membership launched in early 2024 that "rewards consumers for making smart money moves" and adds features like an Insurance Assistant that automatically re-shops a member's policies and a treasury-bills account [17]. The pricing is telling about its purpose. Members pay a $49 annual fee and "have the potential to earn back up to $350 through rewards" for better financial choices [18]: the program can pay out several times what it charges. The company is explicit that this is deliberate. In the FY2024 10-K's own risk factors, NerdWallet+ "is a program to build consumer trust designed to reward consumers for making healthy financial decisions, but it is not anticipated to generate significant profits" [19].
So NerdWallet+ is best read not as a monetization line but as an acquisition-and-retention cost paid to deepen the registered relationship — and the company reports early support for that logic, saying members "have a higher lifetime value than other registered users," who themselves carry the five-times value of a plain visitor [20]. The limitation is that the reader cannot size any of it. NerdWallet has never disclosed a NerdWallet+ member count, a subscription-revenue figure, or a re-engagement revenue contribution. Two years after launch, the membership's scale and unit economics remain a qualitative claim.
What the owned audience changes, and what it does not
The strategy is coherent and points the right way: build a registered, data-rich, re-engageable base so that monetization leans less on buying each shopping session fresh. On the company's figures the base is large — 28 million at last count — and the per-user value gap is real if the five-times claim holds. That is a genuine hedge against the structural search headwind, and the company's own answer to the organic-search erosion traced in Search Disruption.
What it does not yet do is neutralize that risk, for reasons the evidence makes plain. The owned base is still small against the traffic the marketplace must buy each period — the same performance-marketing spend that climbed toward half of revenue in Bought Traffic — and its magnitude is unproven because the two metrics that would prove it, the registered count's recent trajectory and any NerdWallet+ disclosure, are exactly what the company withholds. Management's own margin math confirms the pressure is present tense: it has been opening the "top-of-funnel at a larger scale but at lower incremental margins," and in early 2025 it replaced its "2026 margin percentage target with a margin dollar target" to reflect that mix shift [21]. The owned audience is being built while the spread on bought traffic compresses; the read is most sensitive to the relative pace of the two, and the disclosure that would show it has stopped.
The read that fits the evidence: registration is a real, correctly-aimed asset that improves the quality of NerdWallet's audience, but at disclosed scale it is a hedge against the search-erosion thesis, not a refutation of it. What would move that read is disclosure the company could give and has not — a NerdWallet+ member count or subscription-revenue line, registered re-engagement revenue, or a resumed registered-user figure showing the base still compounding. Continued silence on all three is itself a soft signal.
Watch item: NerdWallet last quantified its registered base at 28 million in August 2025 and has never disclosed a NerdWallet+ member count or subscription-revenue figure. A resumed registered-user number, or any sizing of NerdWallet+, would show whether the owned-audience build is scaling fast enough to offset the free-funnel decline.
Since 2023, NerdWallet has returned almost exactly its entire free cash flow to shareholders — roughly $236 million of buybacks against about $238 million of free cash flow — while using the balance sheet to fund a string of small acquisitions that push the company from pure lead generation toward owning the transaction itself. The buyback is real and now shrinking the float, but most of the 2024–2025 spend was above today's price, and roughly three-quarters of the earlier repurchases only offset shares issued to employees.
The buyback: nearly all the cash, mostly above today's price
NerdWallet began repurchasing stock in May 2023 and has not stopped. Across 2023, 2024, 2025 and the first quarter of 2026 it retired 20.6 million Class A shares for $236.9 million [1] [2] — about 40% of the current $584 million market capitalization. Board authorizations have been topped up seven times, from the first $20 million to the $100 million approved in February 2026, and $89.7 million remained available at 31 March 2026 [3].
The scale is best understood against the cash the bought-traffic model throws off. Free cash flow ran $42.6 million, $50.5 million and $113.4 million across 2023–2025 and about $31.5 million in the first quarter of 2026 — roughly $238 million, against $236 million of repurchases on a cash-flow basis over the same span [4] [5]. Essentially every dollar of free cash has gone to the buyback; the acquisitions below were funded by drawing down cash.
Source: repurchase shares and dollars from FY2025 10-K, Statement of Stockholders Equity [6] and MD&A [7], and Q1 FY2026 10-Q [8]; average price is dollars divided by shares.
The timing has not been kind. The weighted-average price paid across the whole program is $11.53; the stock closed at $8.88 on 24 July 2026. Only the first tranche — 2.3 million shares at $8.82 in 2023 — was bought near the current price. The $217 million spent since, at $11.10 to $12.40 a share, sits above it. The largest single quarter, $66.2 million in the first quarter of 2026 at about $11.10, was executed just before the May 2026 derating that took the shares to $7.58 [9]. In hindsight the program bought high; the offsetting fact is that it was funded entirely from cash, never debt, and the shares are cheaper on the same cash multiples now than when most of it was spent.
What the buyback actually did to the share count
A repurchase worth 40% of the market cap did not shrink the float by anything like that. Between the end of 2022 and May 2026, shares outstanding fell from 75.1 million to 65.8 million — down 12% [10] [11]. Across 2023–2025 the company retired 14.6 million shares but issued 10.8 million to employees through option exercises, restricted-stock settlement and the purchase plan, so about three-quarters of those repurchases replaced dilution rather than reducing the count [12].
Source: year-end share counts from FY2025 10-K, Statement of Stockholders Equity [13]; May 2026 count (34.1m Class A plus 31.7m Class B) from Q1 FY2026 10-Q cover [14].
The count even rose in 2023, when a $20 million buyback was smaller than the equity issued that year. The picture has since improved: stock-based compensation is falling (from $38.8 million in 2023 to $28.6 million in 2025, covered in Financials and Estimates), and the heavier 2025 and first-quarter-2026 repurchases have begun to shrink the float in earnest — diluted weighted-average shares fell 8.7%, from 76.1 million to 69.5 million, between the first quarters of 2025 and 2026 [15]. The read is a program that started as a dilution offset and is now genuinely retiring stock — at prices that, so far, have proved too high.
The other use of cash: buying its way down the funnel
Alongside the buyback, management has been assembling pieces of a different strategy. What Tim Chen calls the "vertical integration" playbook — pairing NerdWallet's brand and traffic with businesses that own more of the transaction — began with Fundera in small-business lending (2020) and On the Barrelhead in loan matching (2022), and has accelerated into services NerdWallet had never operated:
| Acquisition | Closed | Cash paid | What it adds |
|---|---|---|---|
| Next Door Lending | Oct 2024 | $1.0m | Direct mortgage brokerage |
| NerdWallet Wealth Partners | Jun 2025 | $5.0m | Registered investment adviser |
| Private financial-services firm | Nov 2025 | $8.1m | Undisclosed |
| College Finance (Candidly) | Feb 2026 | $17.2m | Student-loan marketplace |
Source: FY2025 10-K business-combinations note [16] and Q1 FY2026 10-Q [17].
The dollars are small — under $35 million of cash across four deals — but the direction is a genuine strategic shift. Next Door Lending makes NerdWallet a licensed mortgage broker rather than a referrer, with a warehouse credit line, state-by-state licensing, and, in the company's own words, "limited experience operating a mortgage brokerage business" [18]. Wealth Partners makes it a discretionary investment adviser; the insurance push (covered in Insurance Concentration) added a branded agency. These are lower-margin, higher-compliance, more operational businesses than the near-costless referral model that produced the cash funding them. Chen frames the logic plainly: vertical integration will "be key to bringing more people to us directly," deepening relationships that AI-driven search erosion (see Search Disruption) is loosening at the top of the funnel [19].
Two details temper the "cheap bolt-on" reading. First, the headline prices understate the cost: each deal carries retention stock grants excluded from the purchase price — $5.0 million to the co-founders of the November 2025 target, $3.1 million at College Finance — that land in stock-based compensation over the following years [20] [21]. Second, capital deployed outside the core has already produced one write-off: an $8.1 million strategic equity investment made in 2024 was assessed as fully impaired within the same year [22]. Goodwill itself has not been impaired [23].
The people spending the money
Capital allocation in a controlled company runs through a small group, and the alignment at the top is real. Chen took $1.54 million in 2025 — all cash, no equity grant — because with 50% of the economics his incentive is already the share price, not an annual award [24] [25]. That is the cleanest argument that the buyback is being run for per-share value rather than optics.
The counter sits in the executive ranks. Both of the officers who joined Chen at the top of the summary table are recent arrivals or recent departures. Lauren StClair, who joined in 2020 to lead the IPO, left as chief financial officer in March 2025; John Lee, formerly of Divvy Homes and Blackstone, replaced her and was paid $6.27 million in 2025, almost entirely in new-hire equity [26] [27] [28]. Sam Yount, who came in through the On the Barrelhead acquisition in 2022 and ran the business side, resigned as chief business officer on 3 April 2026, forfeiting all unvested awards [29]. A finance chief and a business chief both turning over inside eighteen months is normal churn in isolation; it is worth noting because it lands exactly as the company pivots into operating businesses it has never run.
What the record shows, and what would change it
The evidence points to disciplined intent executed at awkward prices. Management is returning all of its free cash flow through buybacks and reinvesting the balance sheet into a coherent vertical-integration strategy, with a founder whose incentives are aligned and no debt behind any of it. The strongest fact against that read is price and share count: the bulk of $236 million was spent above the current quote, three-quarters of the earlier repurchases merely offset employee dilution, and the largest single tranche preceded a 35% drop. The strategy it is funding trades high-margin referral economics for lower-margin operating ones the company concedes it is still learning.
What would change the read in either direction is observable. If the 2025–2026 repurchase pace keeps shrinking the diluted count while cash — already down from $98.3 million to $56.3 million in a single quarter [30] — holds, and the acquired businesses lift rather than dilute margin, the capital story confirms the durability case. If underwater buybacks continue to drain cash while the operating acquisitions weigh on margin, the same activity reads as a company spending its way through a transition rather than compounding through one.
Ownership and Insider Tape
The record of who buys and sells NerdWallet's own stock runs one direction on the open market. No insider has bought a share since founder-chief executive Tim Chen's last purchase in September 2023, and the fresh 2025–2026 tape shows the largest outside holder cutting its stake by roughly a third at a loss and a departed executive still liquidating. Chen has never sold into the market — but neither has he added through a derating that revisited his own purchase prices. For a reader gauging how much pessimism is already in the tape, alignment is intact while conviction is absent.
The ownership register
As of the March 24, 2026 record date, NerdWallet had 65,791,480 shares outstanding — 34,105,828 Class A and 31,685,652 Class B [1]. Chen's Class B, entitled to ten votes a share, gives him 90.72% of the combined voting power on 4.50% of the Class A economics [2]. The register beneath him is short: one concentrated fund, two index-scale institutions, and a handful of officers.
Source: 2026 Proxy Statement (DEF 14A), beneficial ownership as of March 24, 2026 [3]. The proxy marks BlackRock, T. Rowe and Yount voting power as under 1%; the sub-1% figures shown are derived from Class A shares and the one-vote/ten-vote dual-class structure. Topline's 5,294,343 shares and 15.52% are the proxy's figures but not a record-date holding: footnote (2) sources them to a Schedule 13G/A filed November 7, 2024 [4]. Topline reported 3,289,285 shares at June 30, 2026, about 9.6% of Class A.
BlackRock (8.73%) and T. Rowe Price (7.99%) are passive, index-scale positions whose filings say little about a view on the business [5]. The two positions that carry a signal are the founder's and Topline Capital Management's — a single fund that, at the record date, held more of the Class A float than any outside owner.
The one-directional tape
Across 176 recorded Form 4 transactions, the discretionary trades — open-market purchases and sales, setting aside tax-withholding trims on vesting and estate transfers — point almost entirely one way. Chen is the only insider to have bought stock in the open market; every other name on the tape has been a seller.
Source: derived from SEC Form 4 filings, open-market purchases (code P) net of open-market sales (codes S), Dec 2022 – Jun 2026; excludes tax-withholding and gifts [6].
The green bar is the whole of the insider buy side, and it is small and old. The red bars — a concentrated outside fund and a departed executive — are an order of magnitude larger and recent. What the chart cannot show, and what matters, is timing: the selling clustered into the 2025–2026 derating, while the buying stopped well before it.
The founder's tape
Chen bought stock four times between December 2022 and September 2023 — 88,314 shares for about $764,000, at prices from $8.21 to $9.29 [7]. That band brackets today's $8.88 quote almost exactly. The purchases were modest against a stake worth hundreds of millions, but they were open-market buys by a founder, and they signalled conviction near what was then a post-IPO low.
Shares bought (2022–23)
Total spent
Avg price paid
Source: SEC Form 4 open-market purchases by Tim Chen, Dec 2022 – Sep 2023 [8]. Current price $8.88 as of July 24, 2026.
Two things qualify the signal. First, it is stale: the last buy was September 2023, and Chen did not add during the 2025–2026 slide that carried the stock to a $7.58 close in May 2026 — below every price he paid — even though it re-entered his purchase band. Second, open-market buying was never his alignment mechanism to begin with. Chen takes all-cash compensation with no equity grants and controls 90.72% of the vote through Class B, so his skin in the game is the founding stake, not marginal purchases (the pay structure is covered in Capital Allocation) [9].
The counterweight is what Chen has not done: he has never sold a share into the market. His only reductions are automatic tax withholding on vesting awards, and roughly 22.8 million shares of "gifts" that are estate-planning transfers into entities he still controls — the proxy still credits him with 100% of Class B and 90.72% of the vote after them [10]. No founder distribution into the weakness, but no fresh conviction into it either.
The sophisticated seller
The more pointed signal comes from Topline Capital Management, the concentrated fund whose managing member is Collin McBirney [11]. Topline is the closest thing on the register to the reader's own profile: a fund that took a single large, high-conviction position in a small-cap. The proxy lists it at 5,294,343 Class A shares, or 15.52% — the largest single outside holding on the register, though smaller than BlackRock's 2,977,791 and T. Rowe's 2,725,877 taken together.
Its trades tell a round-trip that ended in retreat. Topline added 461,777 shares in October 2024 at an average of about $11.43, then sold 1,961,860 shares over three sessions in late June 2026 at an average near $9.11 — roughly 20% below that October 2024 purchase price [12].
Two qualifications sit on that arithmetic. The 5,294,343-share starting point is not a record-date holding — footnote (2) to the proxy table sources it to a Schedule 13G/A filed November 7, 2024, so about nineteen months of activity between that base and the June 2026 sales are unobserved, and the subtraction does not close: 5,294,343 less 1,961,860 leaves 3,332,483 against the 3,289,285 shares Topline reported at June 30, 2026, a gap of 43,198 shares [13]. And the October 2024 purchase covers 461,777 shares, about 9% of the position as filed; the cost basis on the other roughly 91% is undisclosed, so the June sales are 20% below the one price Topline has disclosed, not below the position's average cost. On the live figure, 3,289,285 shares is about 9.6% of the 34,105,828 Class A shares outstanding [14] — down about a third from the 13G/A base, not 15.52% of the float.
Added Oct 2024 (sh)
Avg price added
Sold Jun 2026 (sh)
Avg price sold
Source: SEC Form 4 filings by Topline Capital Management / Topline Capital Partners; 2024 purchases and June 2026 sales [15]. Proxy-table stake of 5,294,343 shares, sourced by footnote (2) to a November 2024 Schedule 13G/A rather than to the record date [16].
A concentrated, sophisticated holder added at $11.43 and then sold about a third of its filed position at $9.11. The fair caveat is that a Form 4 shows the trade, not the reason: fund-level redemptions, a mandate change, or year-end tax management can force a sale that says nothing about the manager's view of NerdWallet, and Topline still holds 3.29 million shares — it left the position, it did not abandon it. But absent any such disclosure, the plain reading is that the one outside investor most like the reader chose the exit over the discount.
The one large bid
Set against a founder who has stopped buying and an outside base that is selling, the only sustained buyer of NerdWallet stock is the company itself. NerdWallet has repurchased roughly $237 million of Class A shares from 2023 through the first quarter of 2026 — the mechanics, the underwater average price, and the dilution-offset reality are the subject of Capital Allocation [17]. That corporate bid is real, and it has begun to shrink the float. But it is capital allocation, not a person putting personal money at risk near the current price, and it does not substitute for the insider-conviction signal a fallen-star setup usually looks for.
The routine selling around the edges is worth separating from the discretionary kind. Most officer sales are small tax-withholding trims on vesting equity — Kevin Yuann, Nicholas Tatum and others in the tens of thousands of dollars, mechanical rather than expressive [18]. The one large executive exit is Sam Yount, the former chief business officer who resigned in April 2026 (Capital Allocation); he sold about 1.35 million shares for roughly $18 million over his tenure and continued filing Form 144 notices to sell into July 2026 [19]. A departing executive liquidating is ordinary; it adds selling pressure without adding much information.
What the tape says about priced-in pessimism
The insider record cuts two ways, and both belong in the read. Alignment is intact: the founder controls the vote, has never sold into the market, and is paid in cash rather than dilutive equity, so his interests sit with the long-term stake rather than the next print. That is the skin-in-the-game the setup wants. What is missing is the confirming signal of an insider stepping in to buy the discount. Nobody has, for nearly three years, and the most comparable outside investor has been heading the other way.
The strongest facts against reading the tape as bearish are that Chen's control makes marginal buying redundant, that Topline's motive is undisclosed and could be portfolio housekeeping rather than a verdict, and that the company's own buyback is a genuine, sustained bid on the shares. What would change the read is straightforward and observable: an open-market purchase by Chen or another officer during the current weakness, or Topline stabilizing rather than continuing to sell, would convert an absent signal into a present one. As the record stands through mid-2026, the people closest to NerdWallet are aligned but idle, and the one who traded most recently sold.
Margin of Safety
NerdWallet fails the screen a net-cash special-situation investor runs: net cash was roughly 16% of its market value at the end of 2025, not close to it, and Tim Chen's 90.72% voting control leaves no takeover to underwrite. The protection that remains is a cash-flow floor, not an asset floor — about $113 million of 2025 free cash flow against a $528 million enterprise value. This chapter tests how firm that floor is, reconciles the report to the $8.88 price, and leaves a watch-list.
Why the balance-sheet screen fails here
The reader's usual setup — pay a price near liquidation value, get the growth for free, lose little if a pending deal breaks — does not map onto NerdWallet on two counts.
First, the cash is not the story. NerdWallet held $98.3 million of cash and equivalents at the end of 2025 [1] against no drawn corporate debt: the $125.0 million revolver carried "no outstanding balance … as of December 31, 2025" [2], and the only funded borrowing is a mortgage-warehouse line at a subsidiary that self-liquidates against loans held for sale: a $15.0 million commitment, extendable to $18.75 million for up to 90 days, of which $6.9 million was drawn at 31 December 2025 [3]. Net cash of roughly $91 million on that year-end basis sits under a market value near $584 million. It cushions the equity by about a sixth; it does not define it.
Second, there is no deal to break. NerdWallet is the acquirer, not the target — it bought a mortgage broker, an RIA, an insurance agency and a student-loan marketplace across 2024–2026 (Capital Allocation) — and Tim Chen's 90.72% voting control [4] means the company cannot be taken over against his will. The event a special-situation investor underwrites simply is not present.
Share Price (24 Jul 2026)
Enterprise Value ($M, Mar-26 cash)
Net Cash / Market Value (Dec-25)
EV / 2025 Free Cash Flow
Sources: share price per market data as of 24 July 2026; net cash and free cash flow derived from FY2025 balance sheet [5] and cash-flow statement, per Financials and Estimates; the enterprise value nets cash held at 31 March 2026, the net-cash percentage is on the 31 December 2025 balance sheet.
Where the floor actually sits
Set against the enterprise value, the protection is the cash the business throws off. NerdWallet reported non-GAAP operating income of $96.0 million and adjusted EBITDA of $145.0 million in 2025 [6], converting to roughly $113 million of true free cash flow after capitalized software (Financials and Estimates). The $528 million enterprise value nets the $56.3 million of cash held at 31 March 2026 [7], the most recent balance and the one this chapter uses; on that basis the business trades at 5.5x 2025 NGOI and 4.7x free cash flow. Netting the $14.9 million drawn on the warehouse line at the same date [8] gives 4.8x; on the FY2025 net-cash basis the enterprise value is about $493 million and the multiple 4.3x. All three are below 5x. Against the guided FY2026 NGOI band of $85 million to $110 million, the same $528 million prices at 6.2x to 4.8x.
The question a cash-flow floor raises is how far the cash can fall before the multiple stops being cheap. Two levers, both established earlier in the report, move it: the auto-insurance carrier cycle (Insurance Concentration) and the erosion of the free organic search top-of-funnel (Search Disruption). Management's own 2026 guidance brackets the near-term range — a full-year NGOI of $85 million to $110 million, with the low end reflecting unrecovered insurance weakness plus vertical-integration spend and the high end assuming the insurance partner is offset in the second half [9].
Source: NGOI range from FY2026 guidance [10]; EV/NGOI derived at the current $528M enterprise value.
Even the downside case leaves the enterprise at about 6.2x NGOI — inexpensive in absolute terms, but with the growth leg gone. That is the honest translation of the special-situation lens onto this name: the downside is bounded by earnings power, not by assets, and the boundary is soft because that earnings power rests on the two levers examined earlier — the insurance line (Insurance Concentration) and the organic-search funnel (Search Disruption). The read here is that a cash-flow floor exists and is cheap; the counter-fact is that both levers under it can move at once — the same March 2026 carrier pullback that pressures insurance coincides with the accelerating vertical-integration spend that pressures margin [11]. What would firm the floor is a second quarter of stable insurance monetization; what would crack it is the low-end guide proving to be the run-rate rather than the trough.
The tension, stated as shared facts
Each row below is a fact both a bull and a bear accept; they part on what it implies and on what would settle it.
Sources: customer concentration [12]; voting control [13]; insurance mix, search, capital and insider detail per Insurance Concentration, Search Disruption, Capital Allocation, Ownership and Insider Tape.
Three of the four rows resolve in the same direction and on a similar timetable: the spend of the insurance carrier management flagged in March 2026, over the next two or three quarters. The scenario range above is most sensitive to that input — the gap between the $85 million and $110 million ends of the guide is largely whether that spend recovers — and the company has just stopped reporting the vertical separately (Bought Traffic), so the trajectory will read through NGOI and the customer-concentration note rather than a clean insurance line.
Reconciling the price
At $8.88 the market pays about 5.5x 2025 NGOI, 4.7x free cash flow, 13.9x GAAP earnings of $0.64 [14], and roughly 6.8x a forward EPS drawn from a single contributor. Consensus expects revenue growth to roughly halve from the 15.8% three-year CAGR to about 6% — $888.6 million in 2026 and $943.9 million in 2027 — matching the company's own mid-to-high-single-digit guide [15]. The earnings side of that consensus is thin: 2026 EPS of $1.30 comes from one analyst and was cut from $1.48, even as the same contributor raised 2027 to $2.06 (Financials and Estimates).
Source: EV of $528M against NGOI and FCF per FY2025 10-K [16] and FY2026 guidance [17].
The arithmetic reconciles cleanly: a low-single-digit-times-cash multiple on a business the market expects to grow at 6% and whose growth engine has one concentrated, cyclical buyer. The $12 sell-side target implies roughly 35% upside from $8.88, on the same thin coverage. At 4.7x free cash flow the multiple is not distress-priced, and it does not embed the 2024–2025 surge continuing; it sits at the level a durable-but-decelerating cash flow and a stabilized insurance line would both support.
What to watch
The items below are checkable in named filings against a stated threshold; each maps to one of the tensions above.
Sources: guidance [18]; customer concentration [19]; buyback authorization [20]; remaining threads per Search Disruption, Capital Allocation and Ownership and Insider Tape.
The setup a net-cash special-situation investor looks for is absent, but the substitute — a cash-flow floor near 5x free cash flow, held up by a founder-aligned buyback — is real and cheap. Its durability turns on whether the insurance line stabilizes and whether the organic-search decline is offset before the cash it funds erodes. Those are watchable, not yet decided.
Balances and per-share figures are in US dollars, NerdWallet's reporting and trading currency.