NerdWallet, Inc.'s management explains the business in its own materials. The slides below do the most of that work, pulled from the documents preserved in Sources. Each source link opens the complete presentation at that slide in a new tab.
The only standalone company-overview deck here: business model, market structure, unit economics and the 2026 targets, drawn rather than written. · Open the full document →
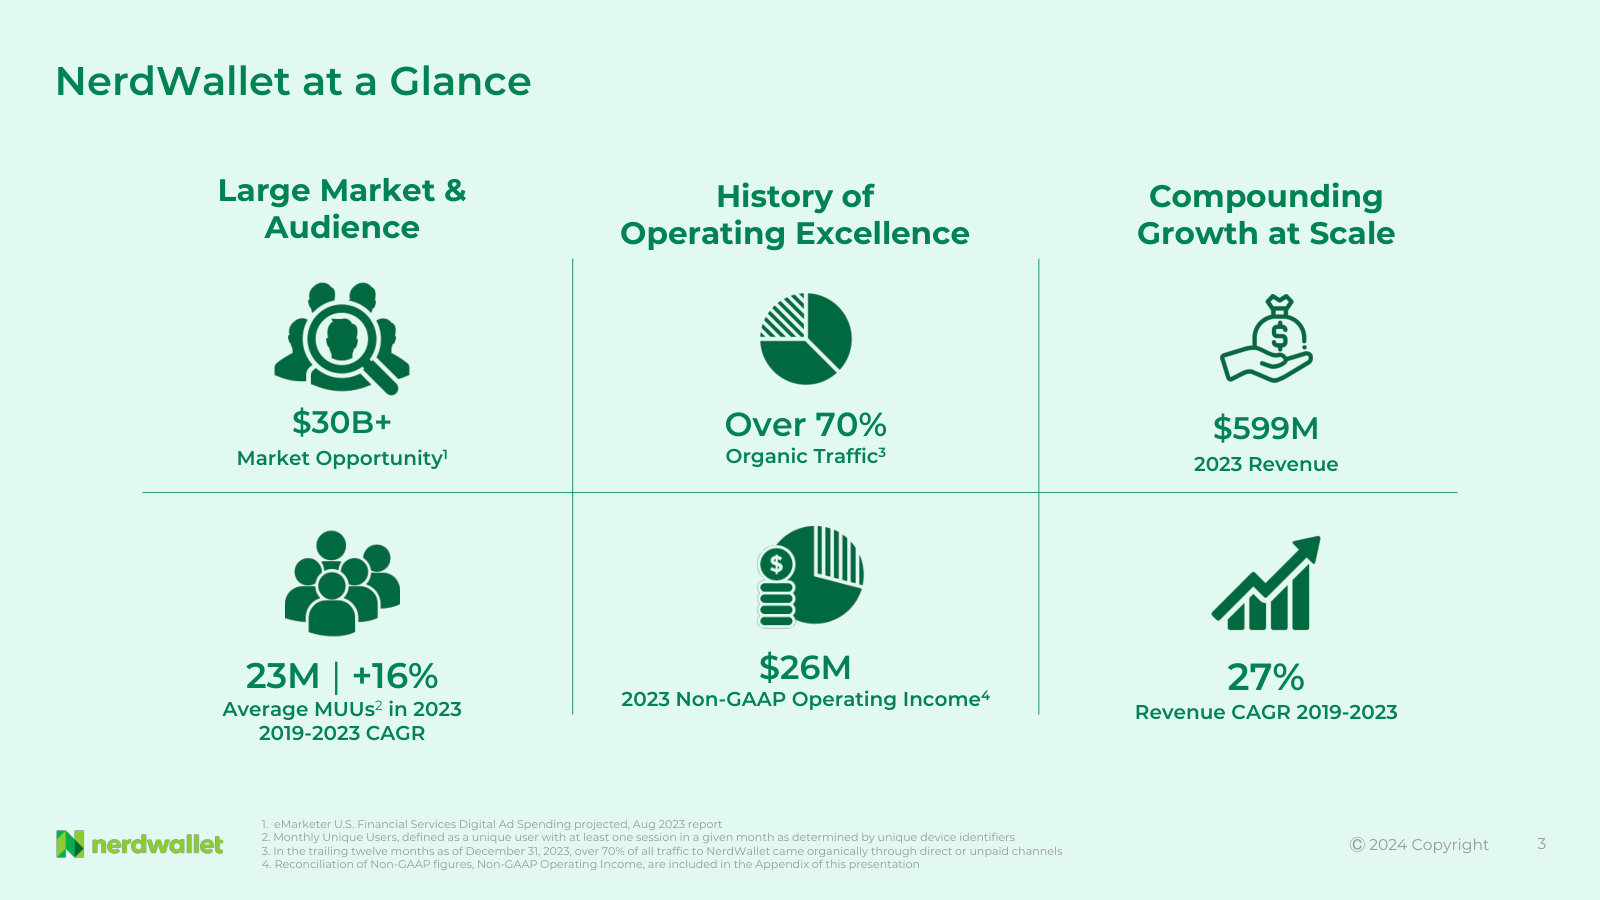
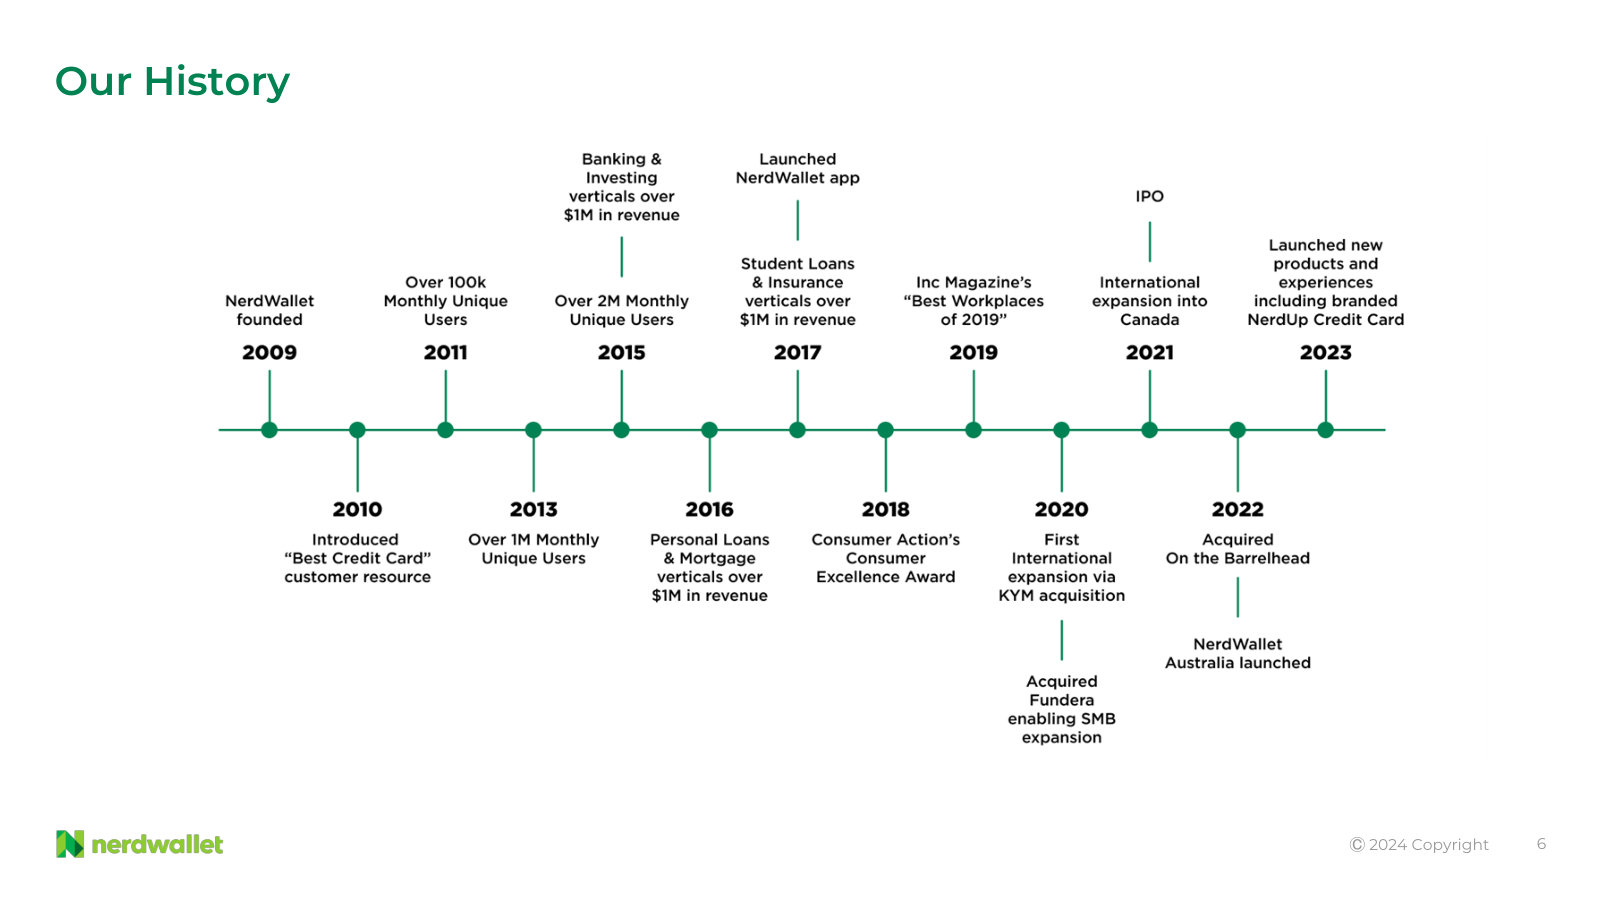
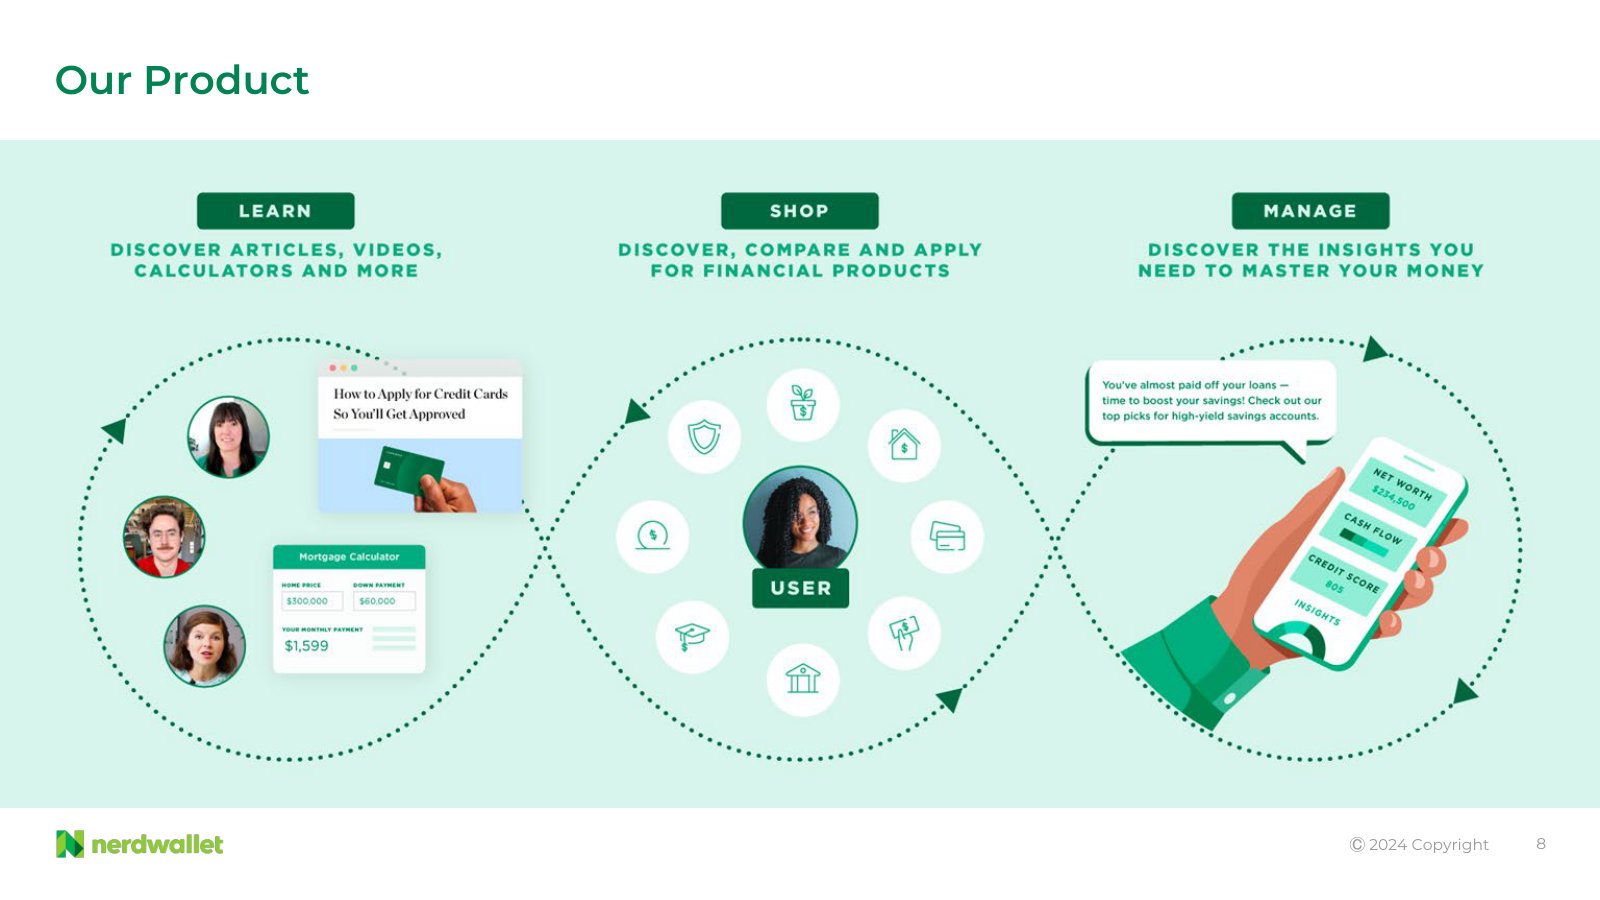
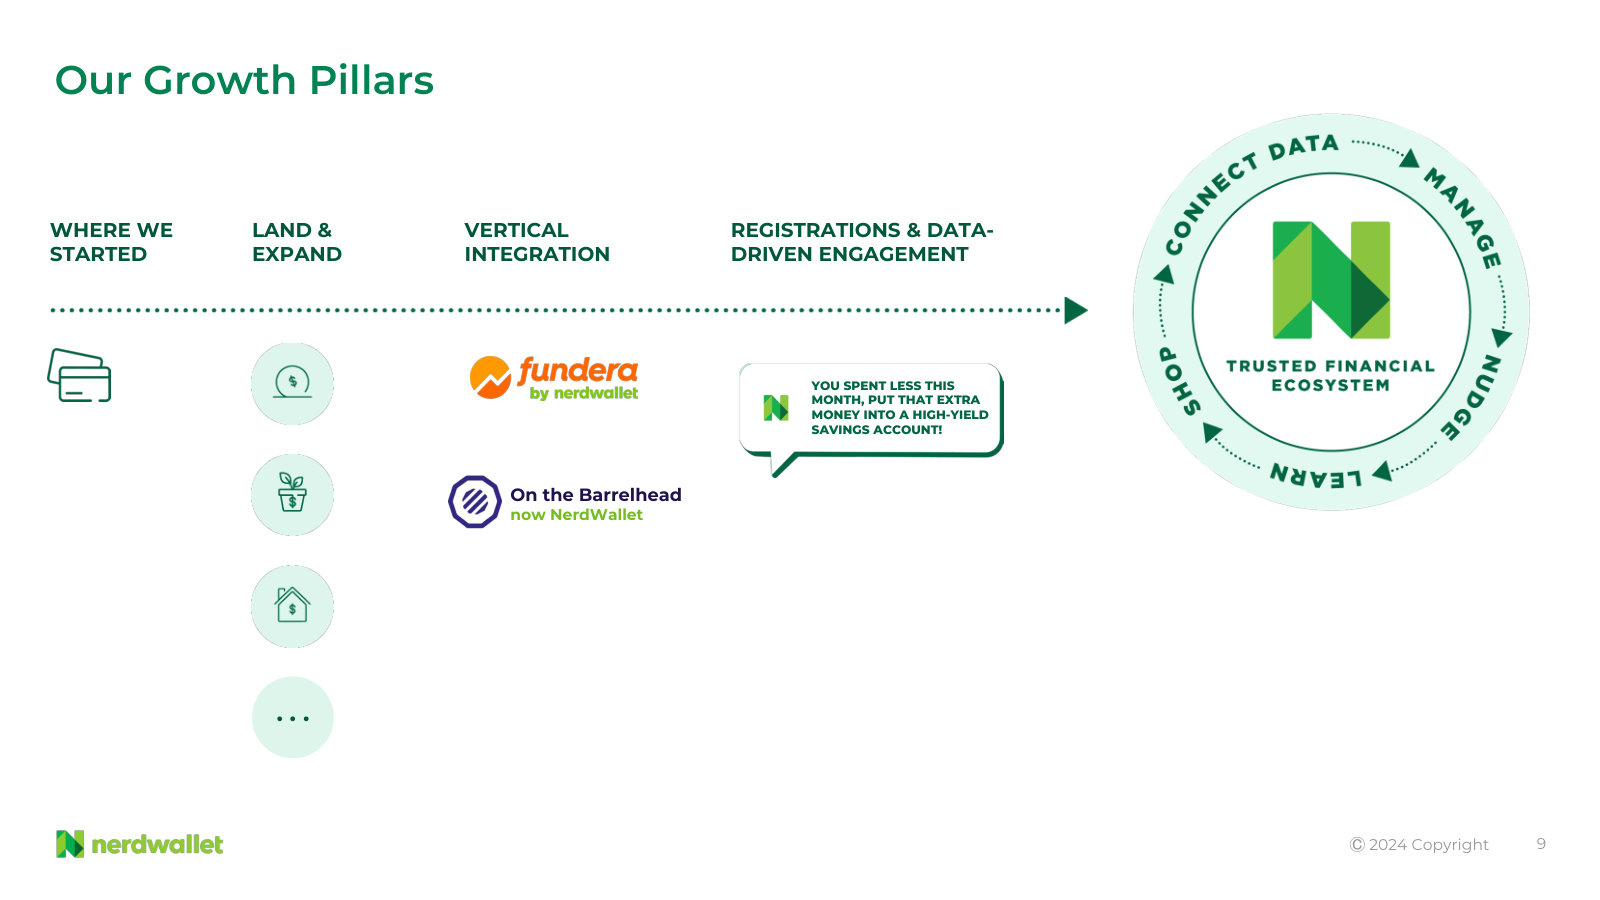
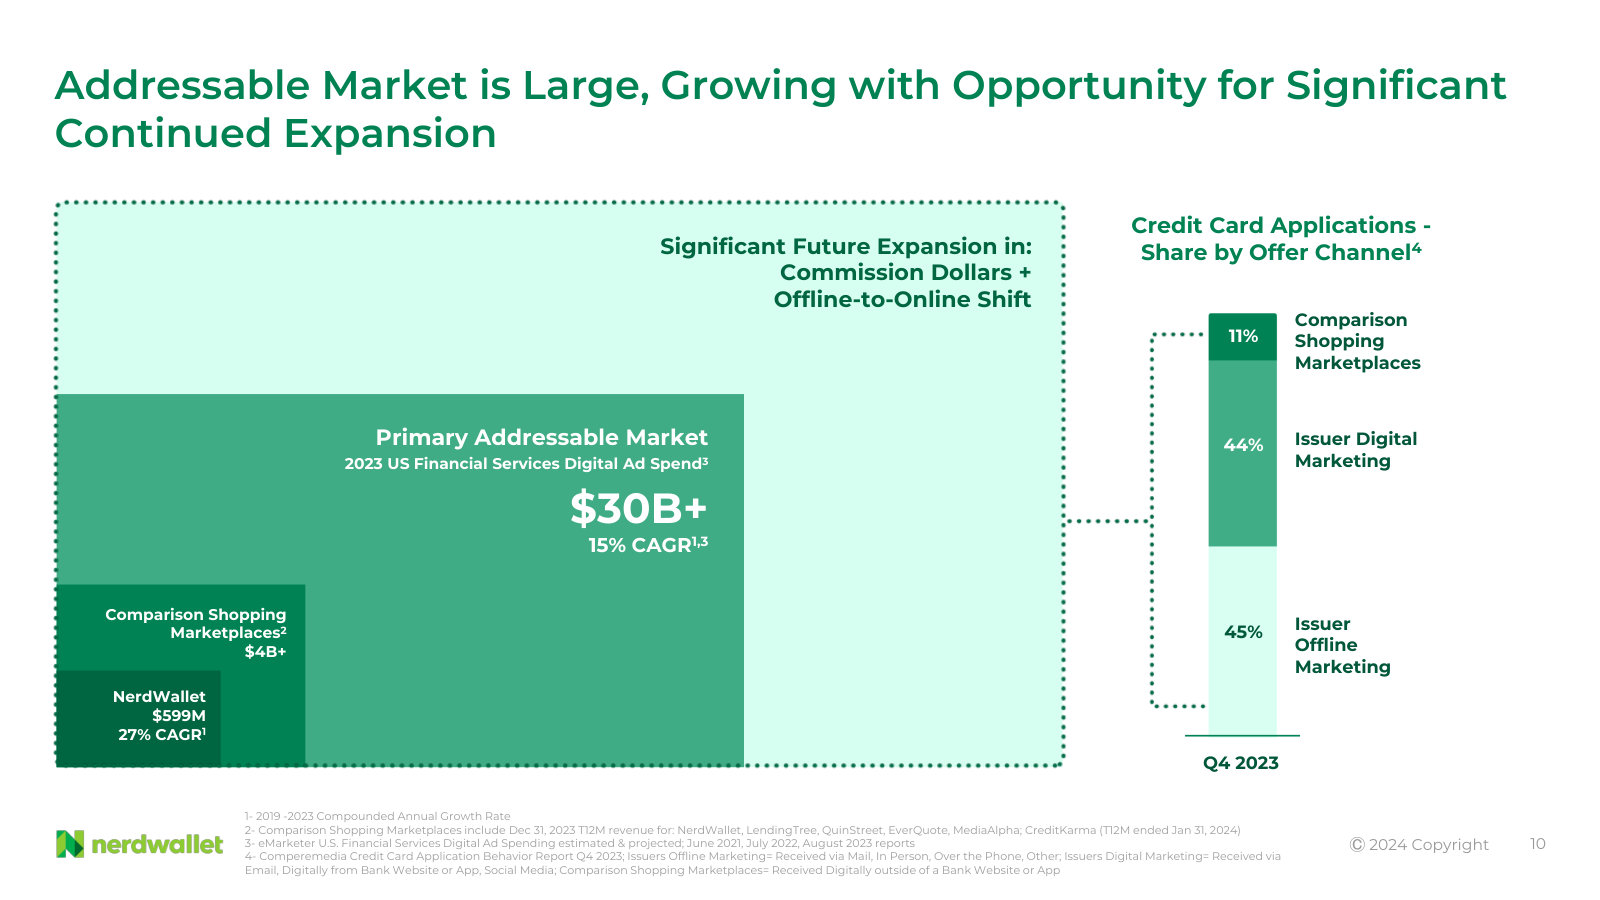
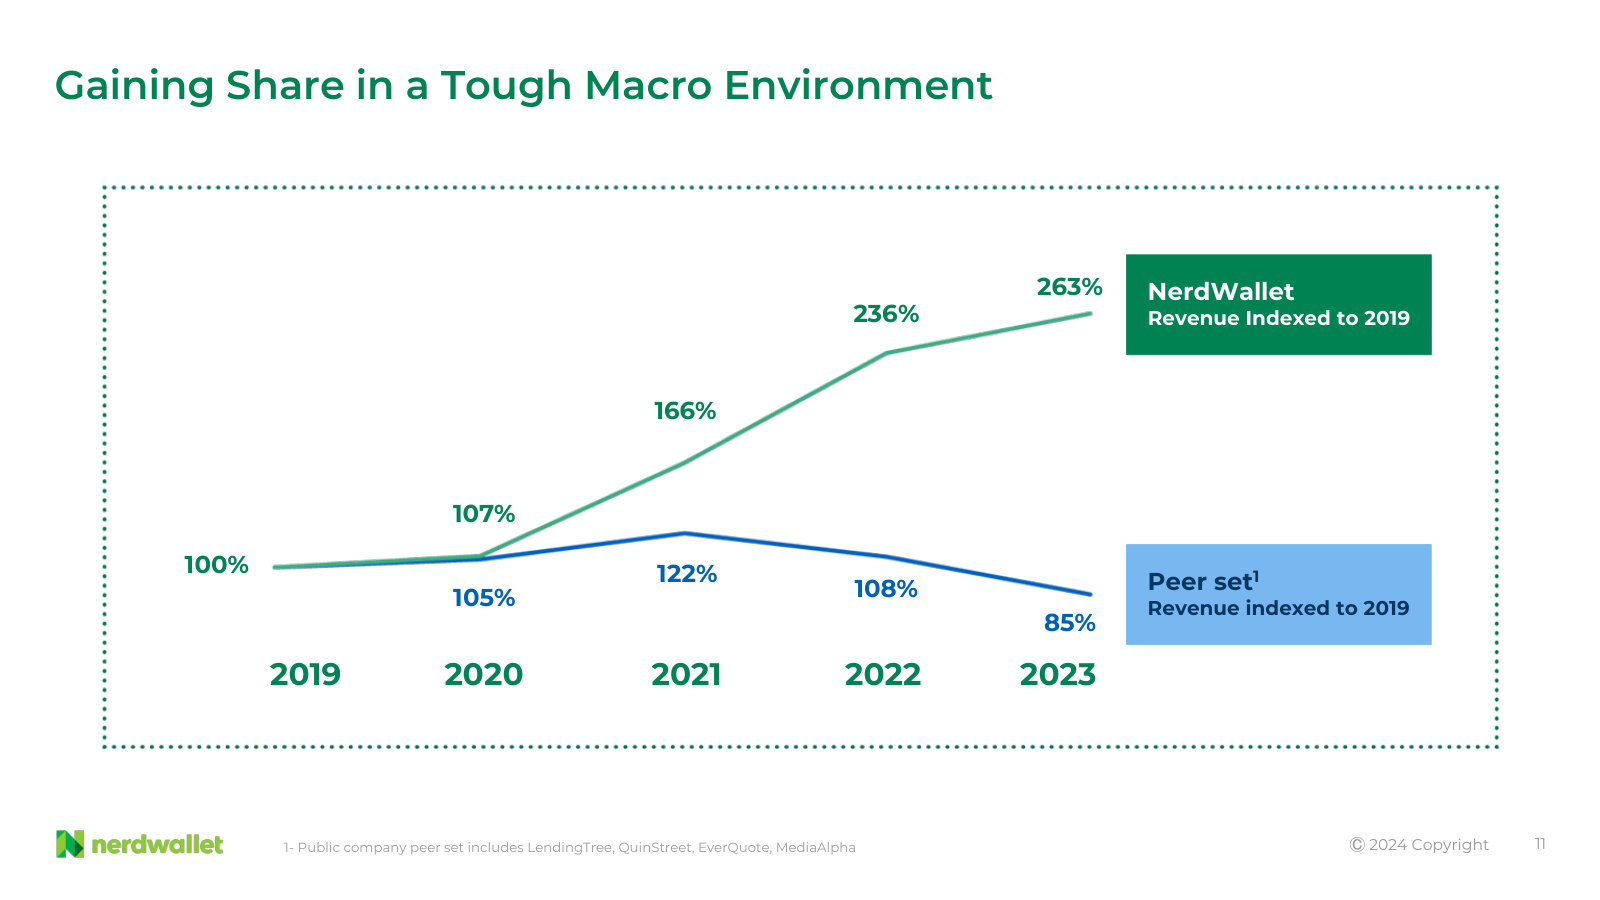
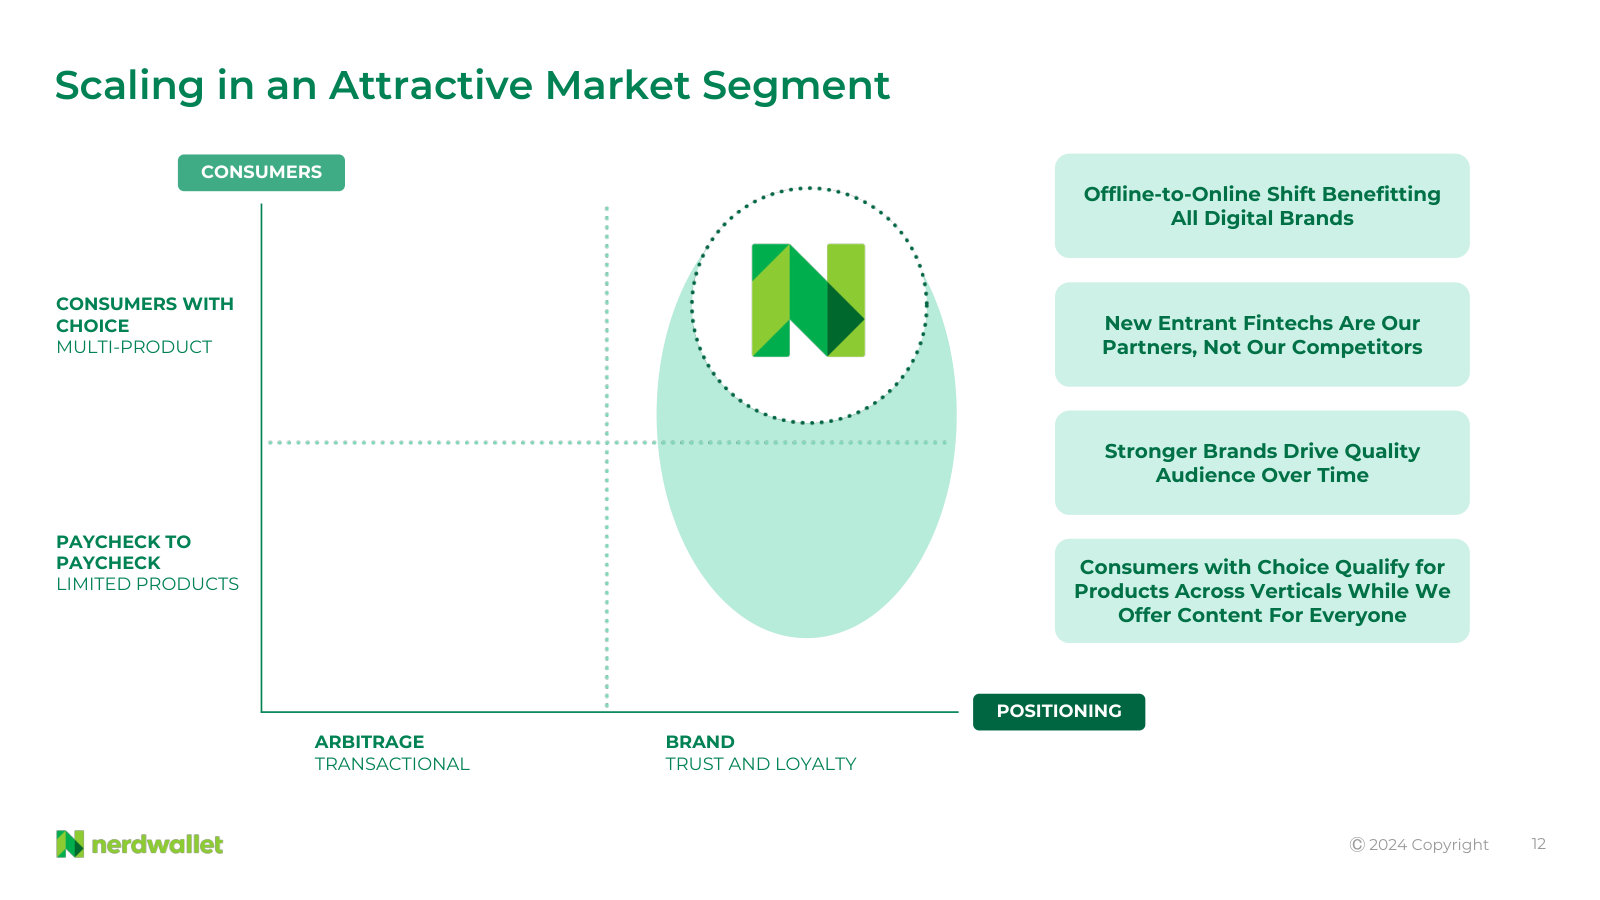
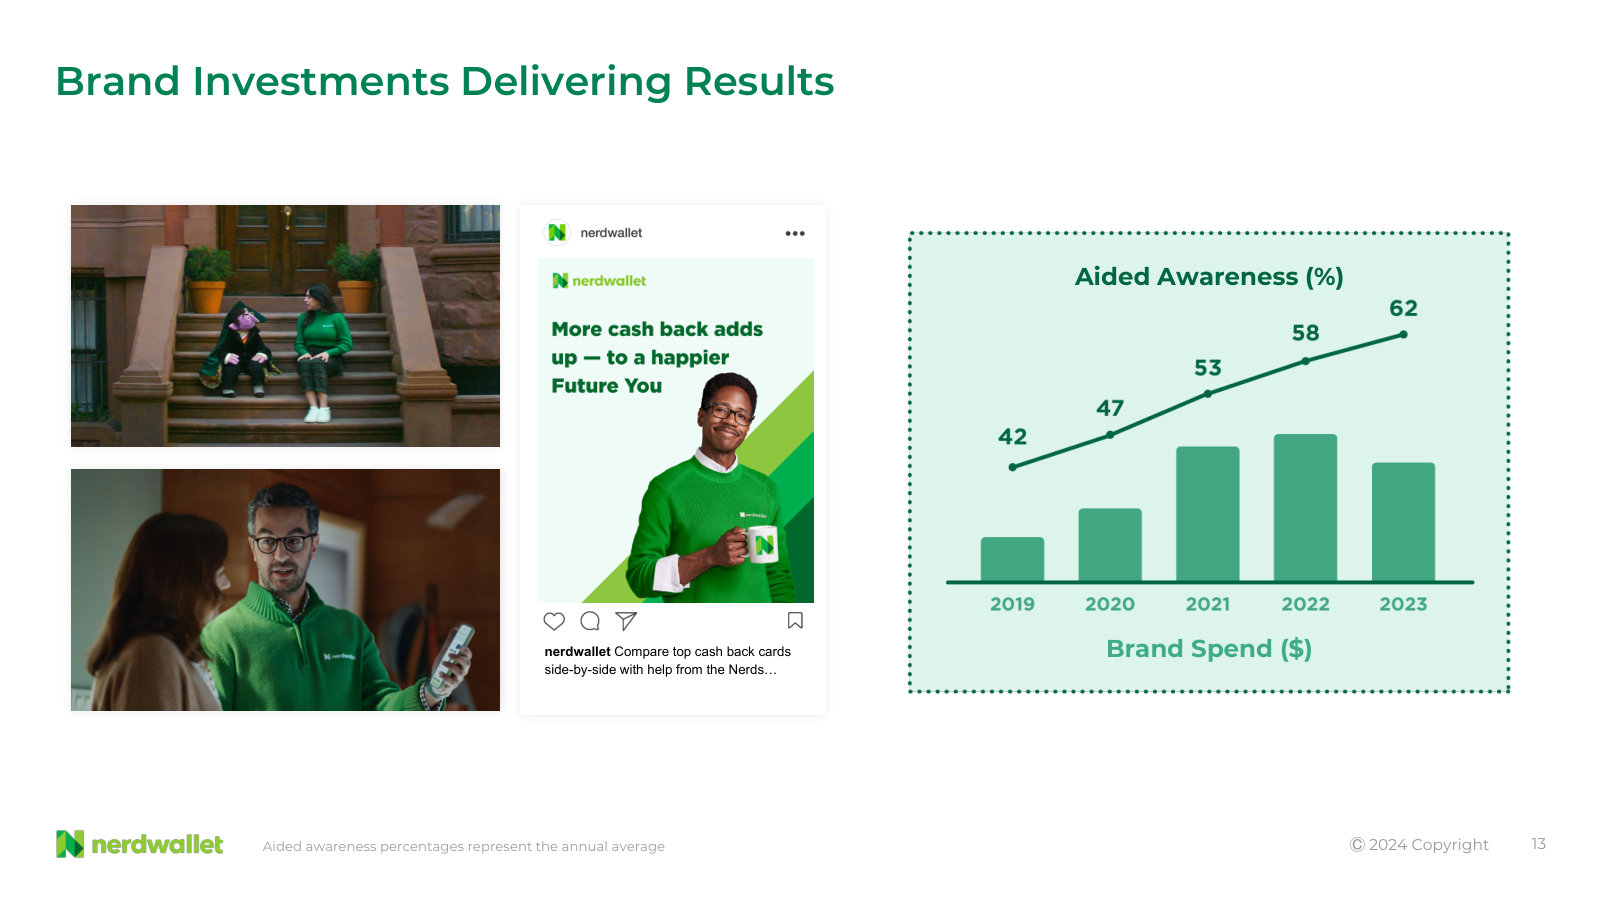
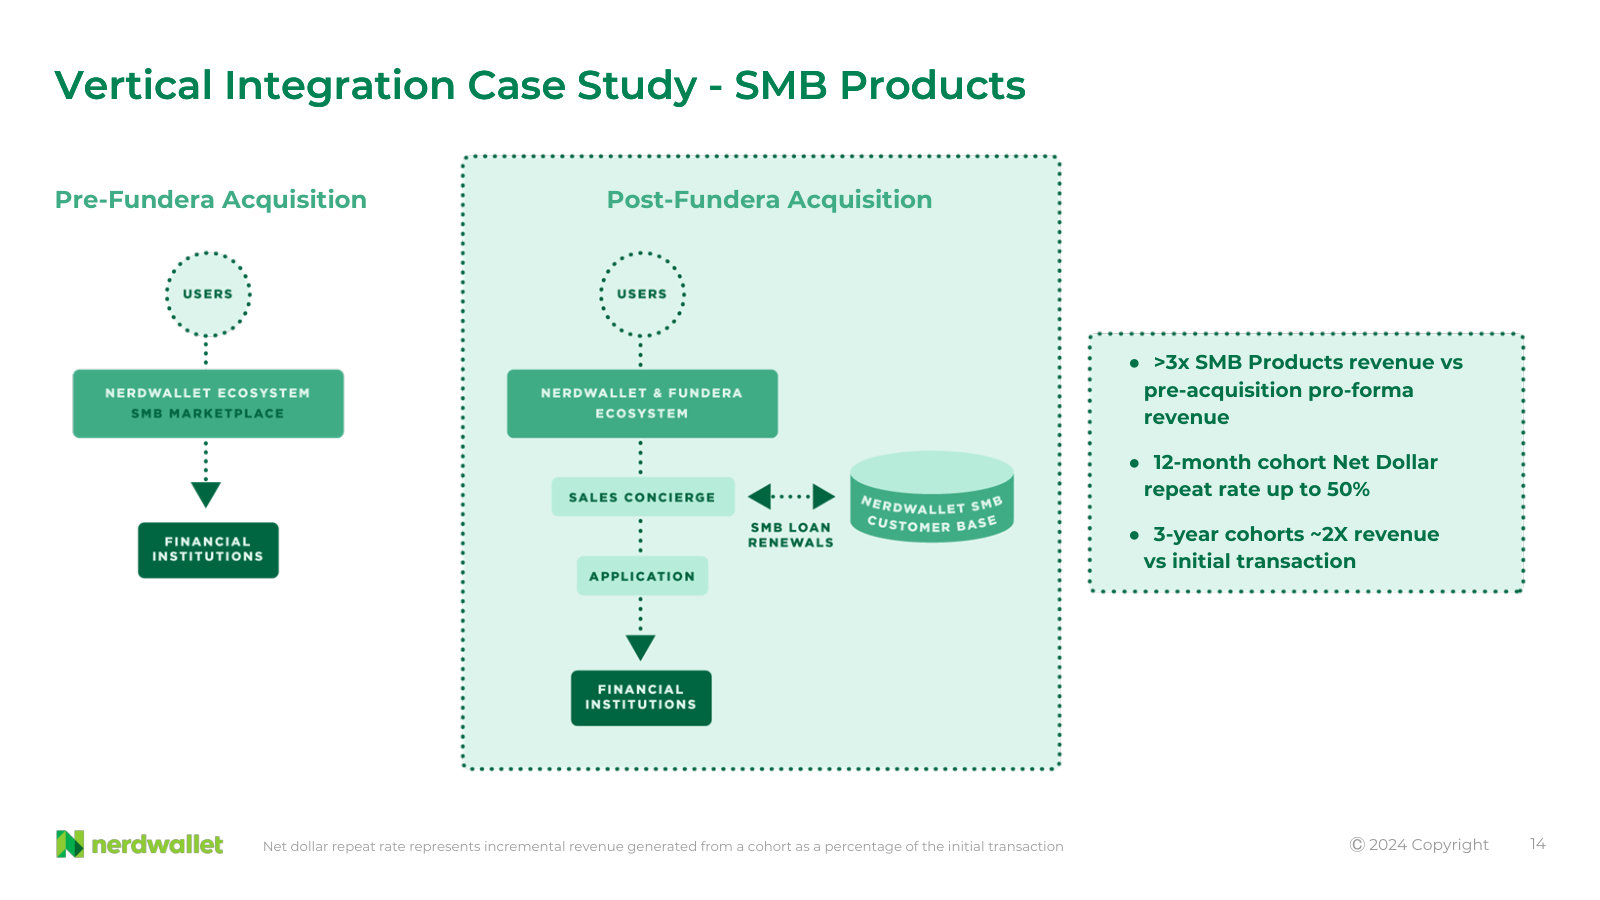
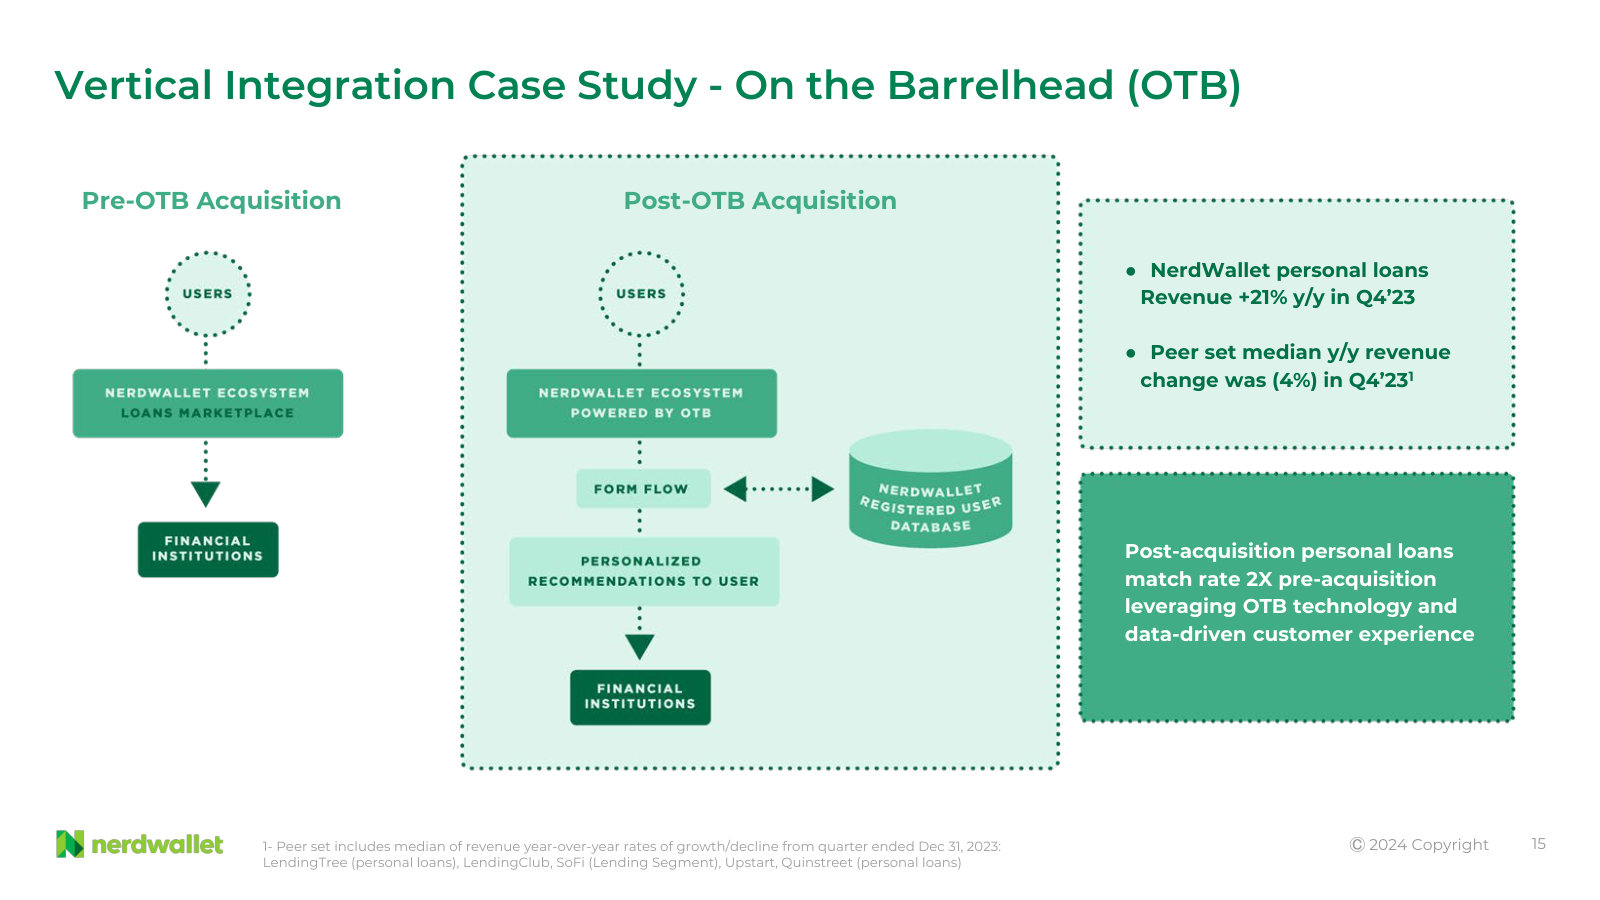
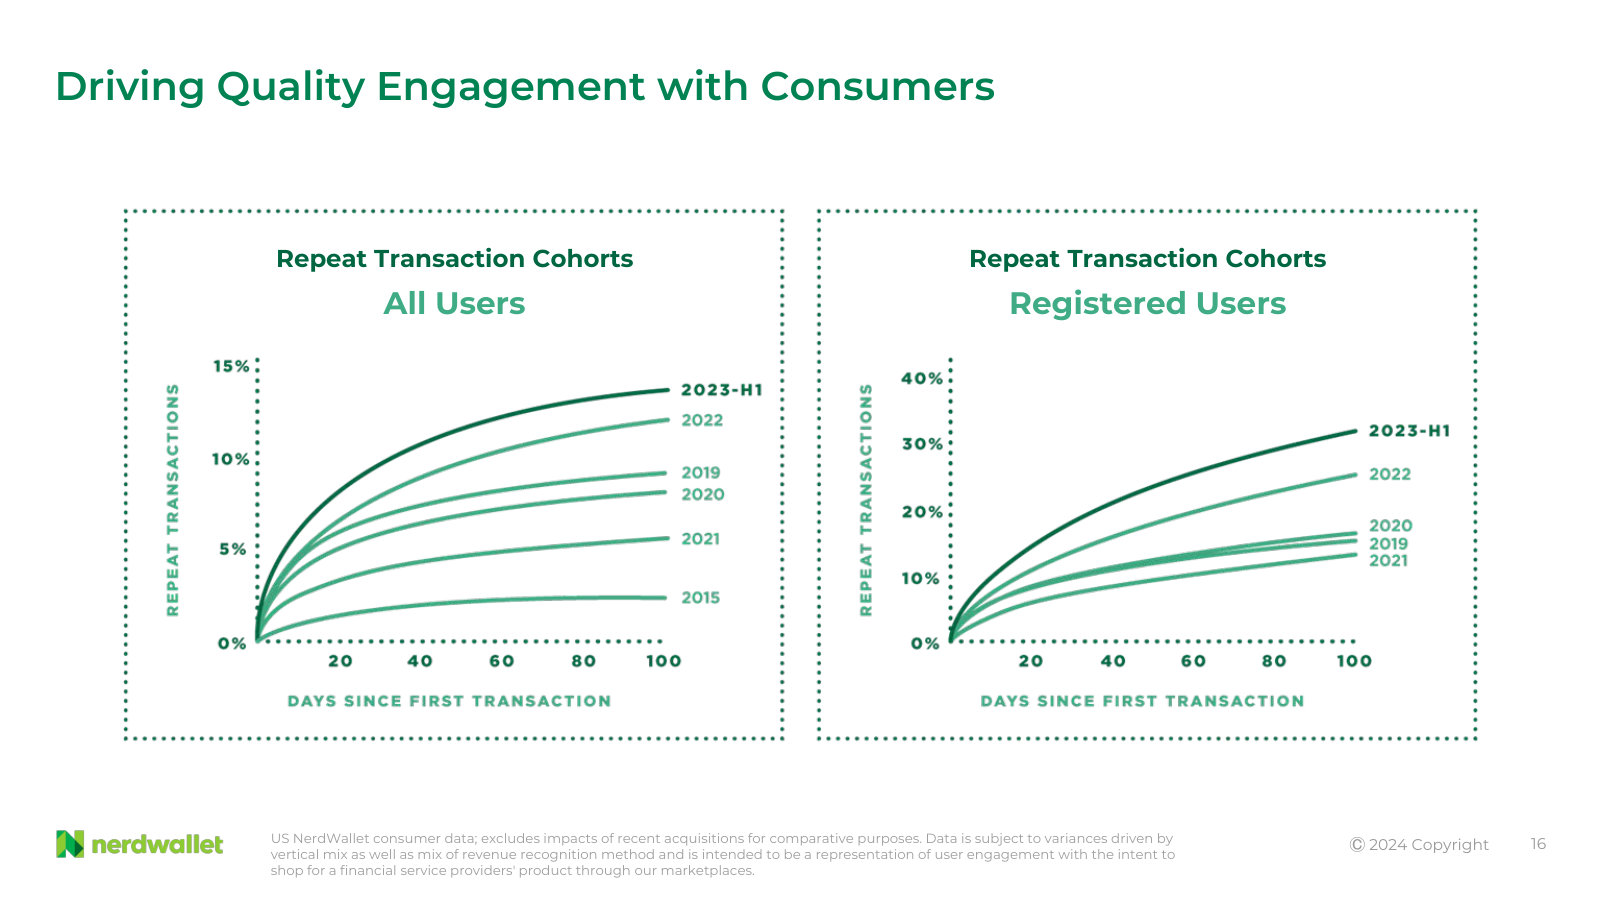
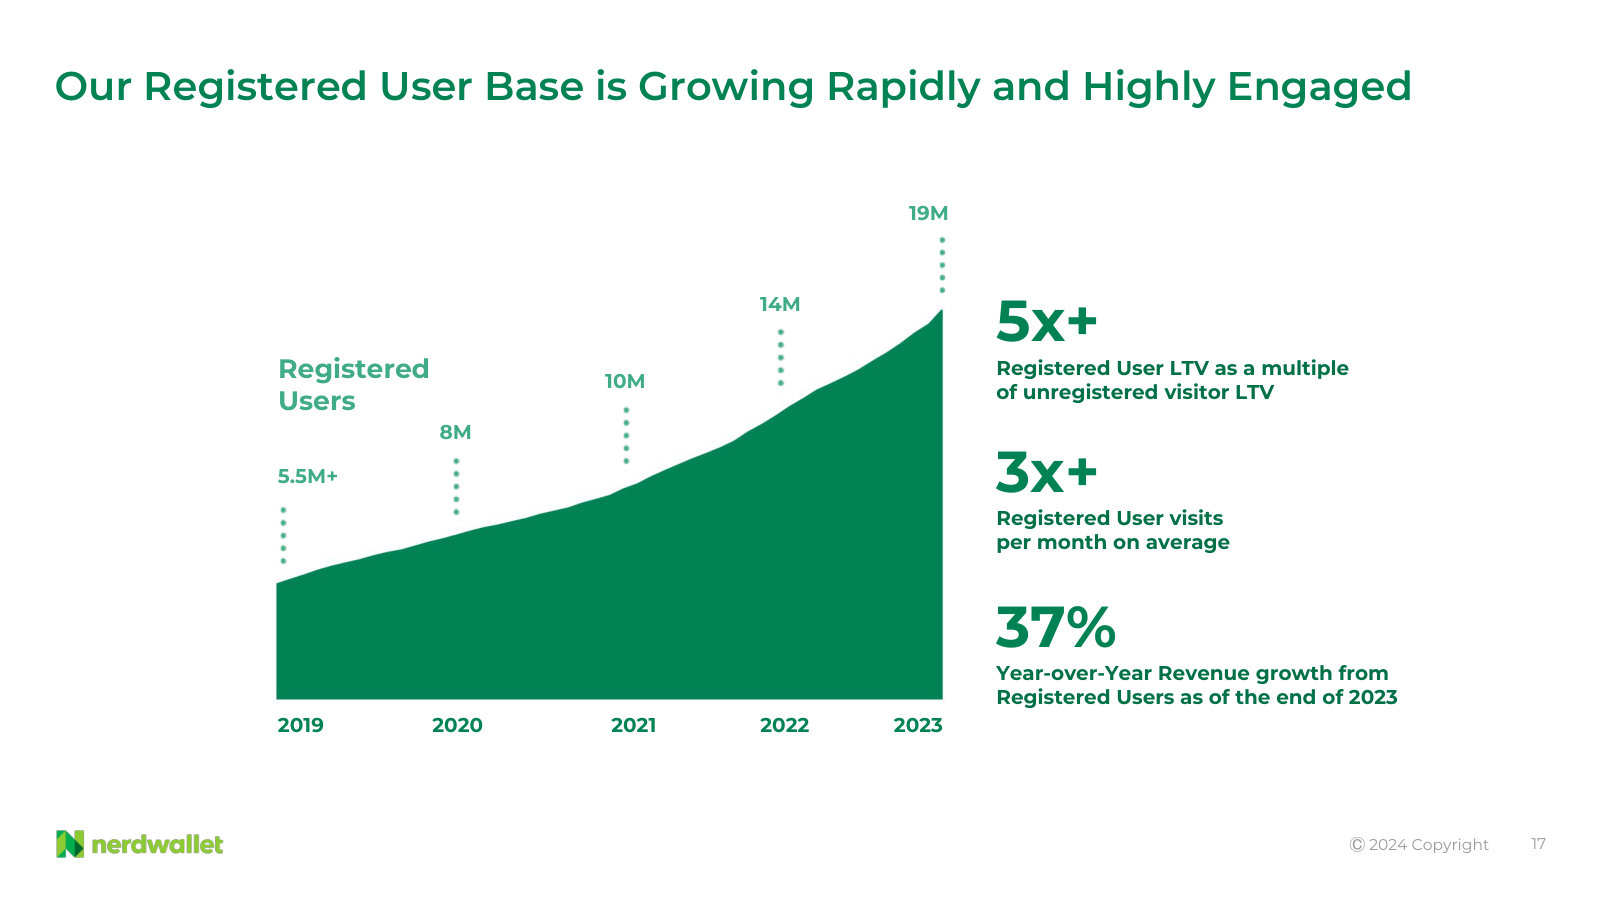
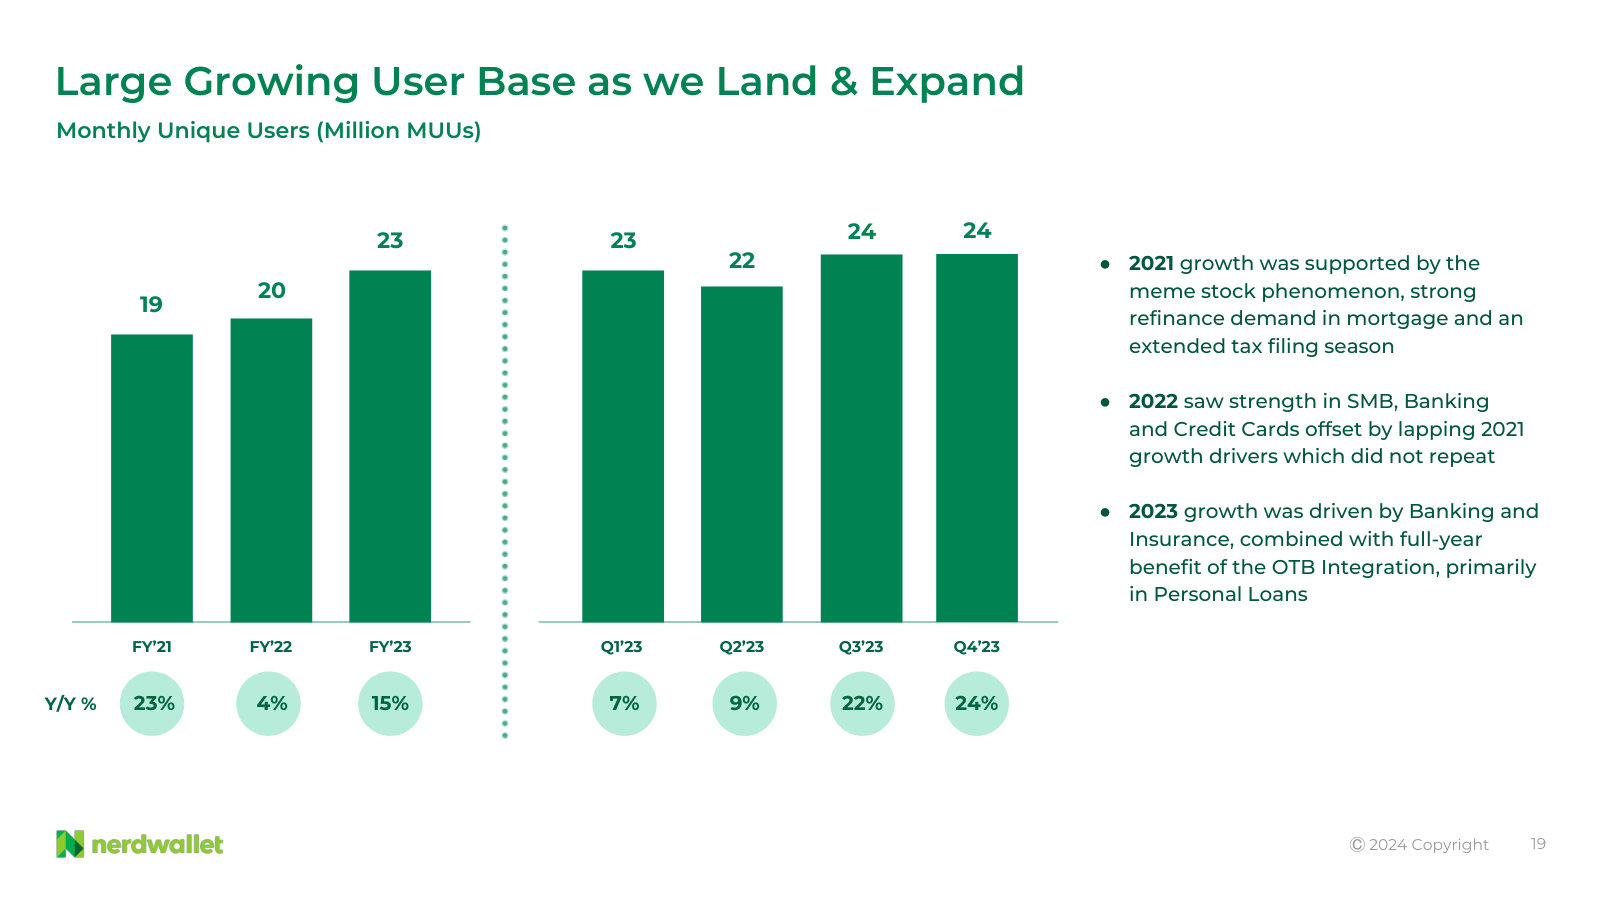
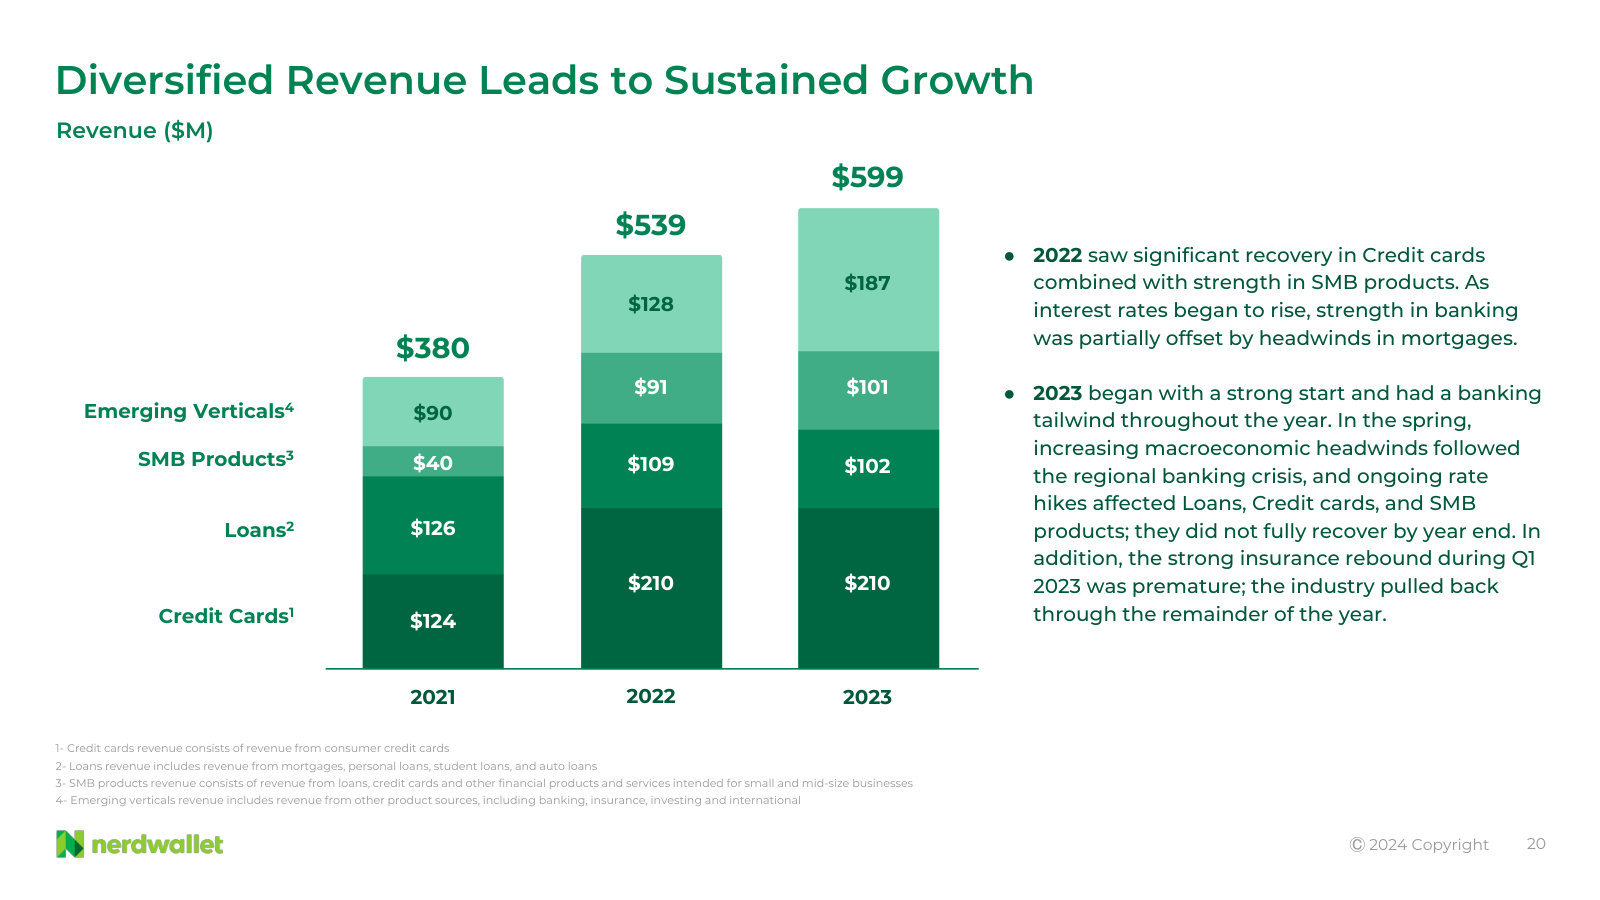
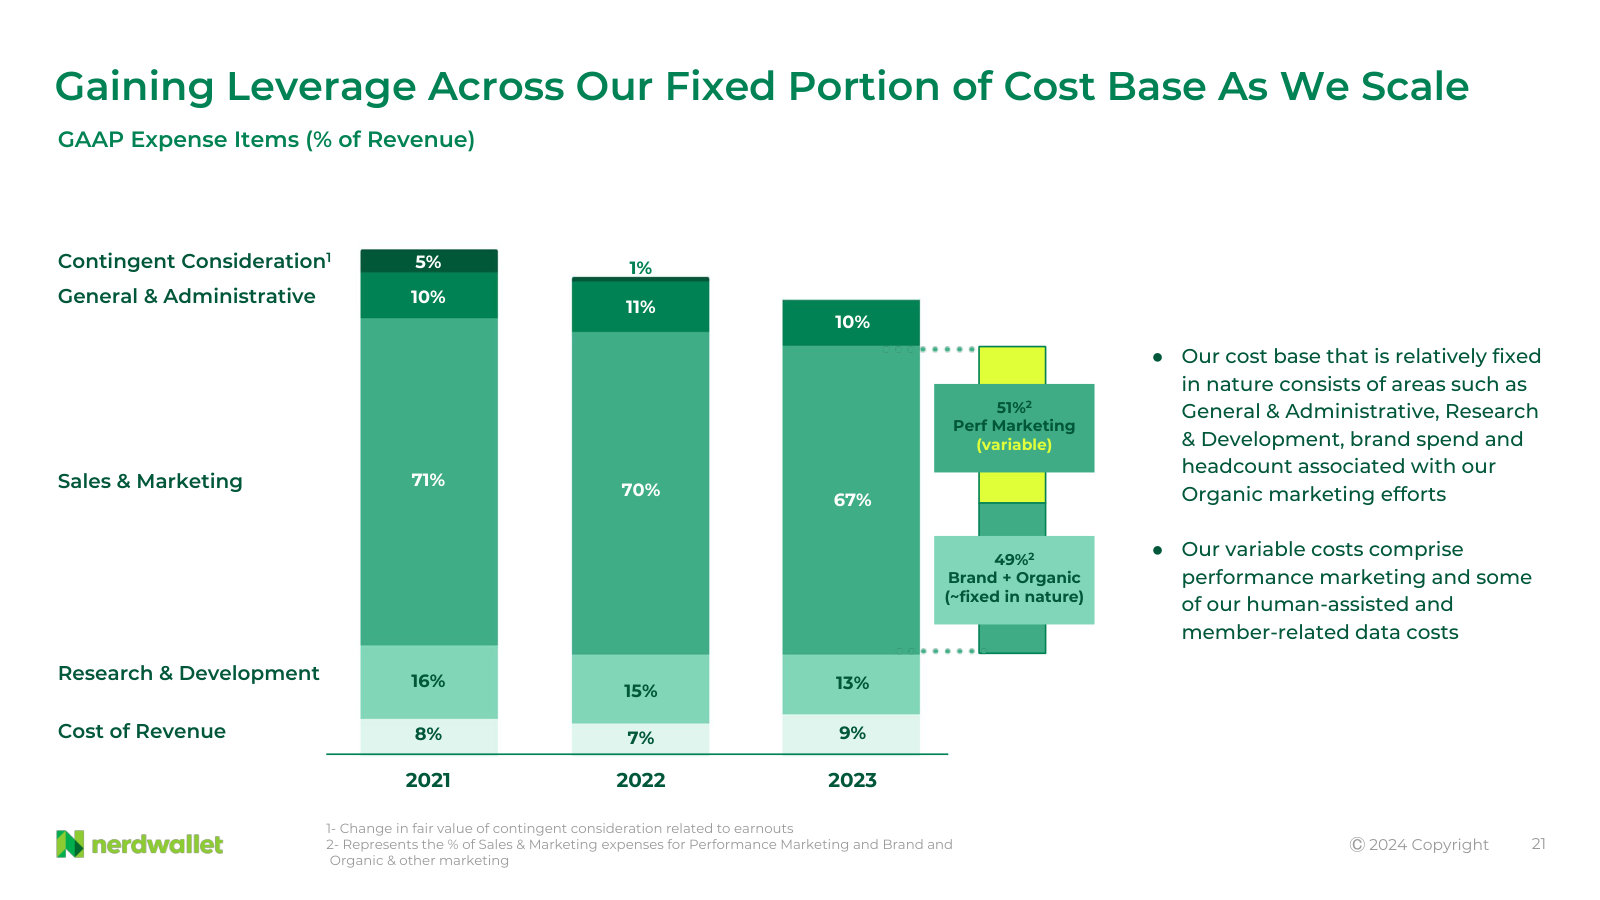
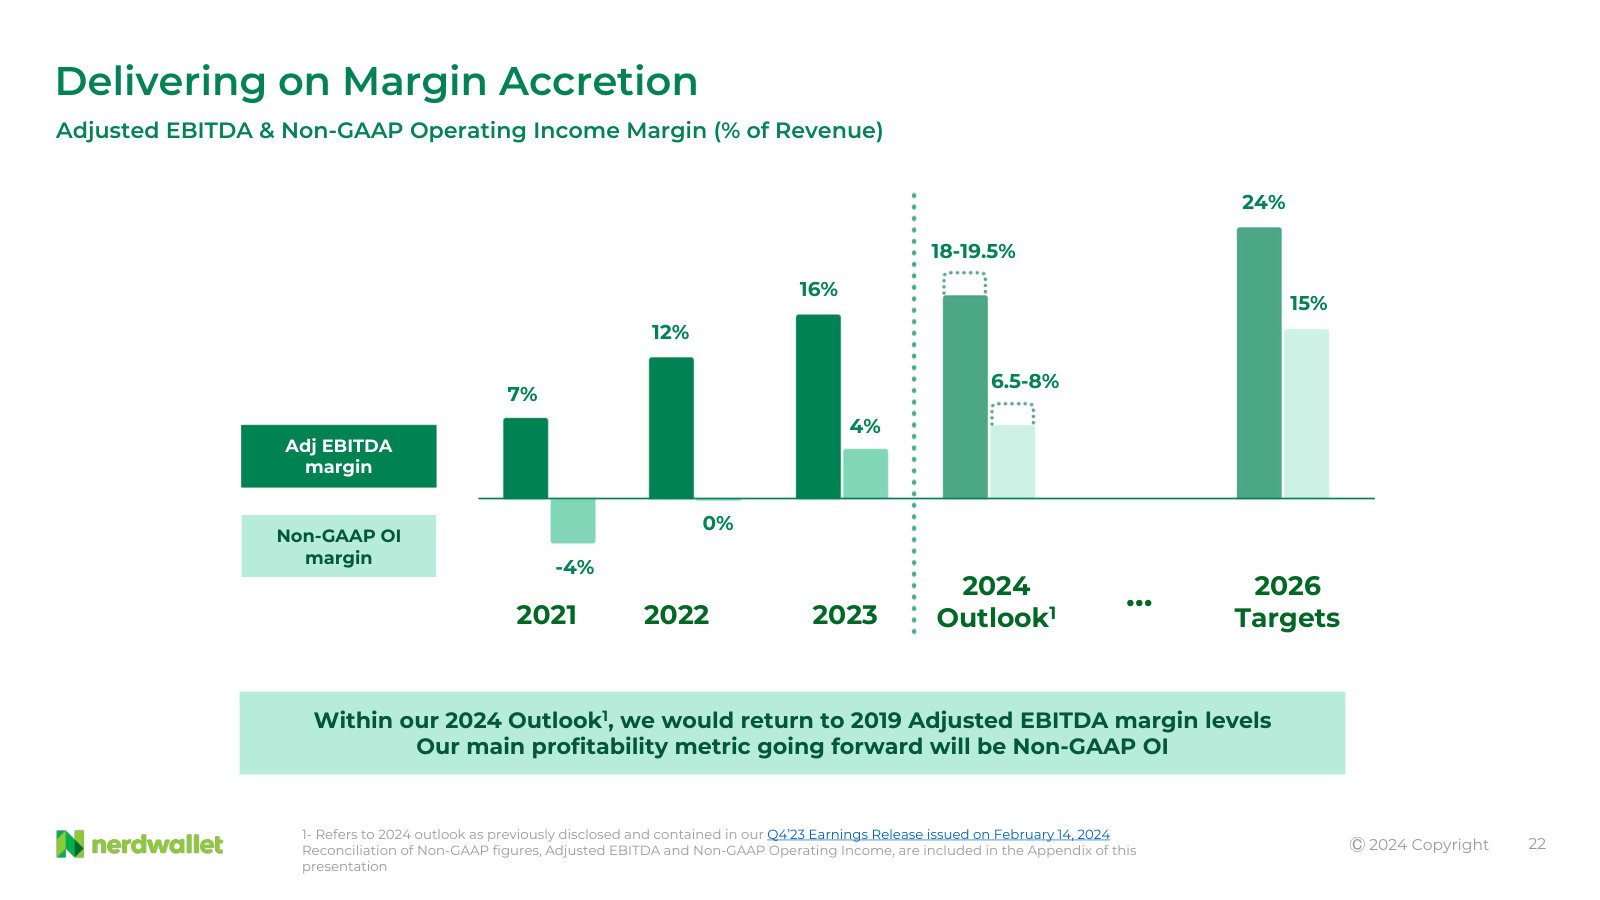
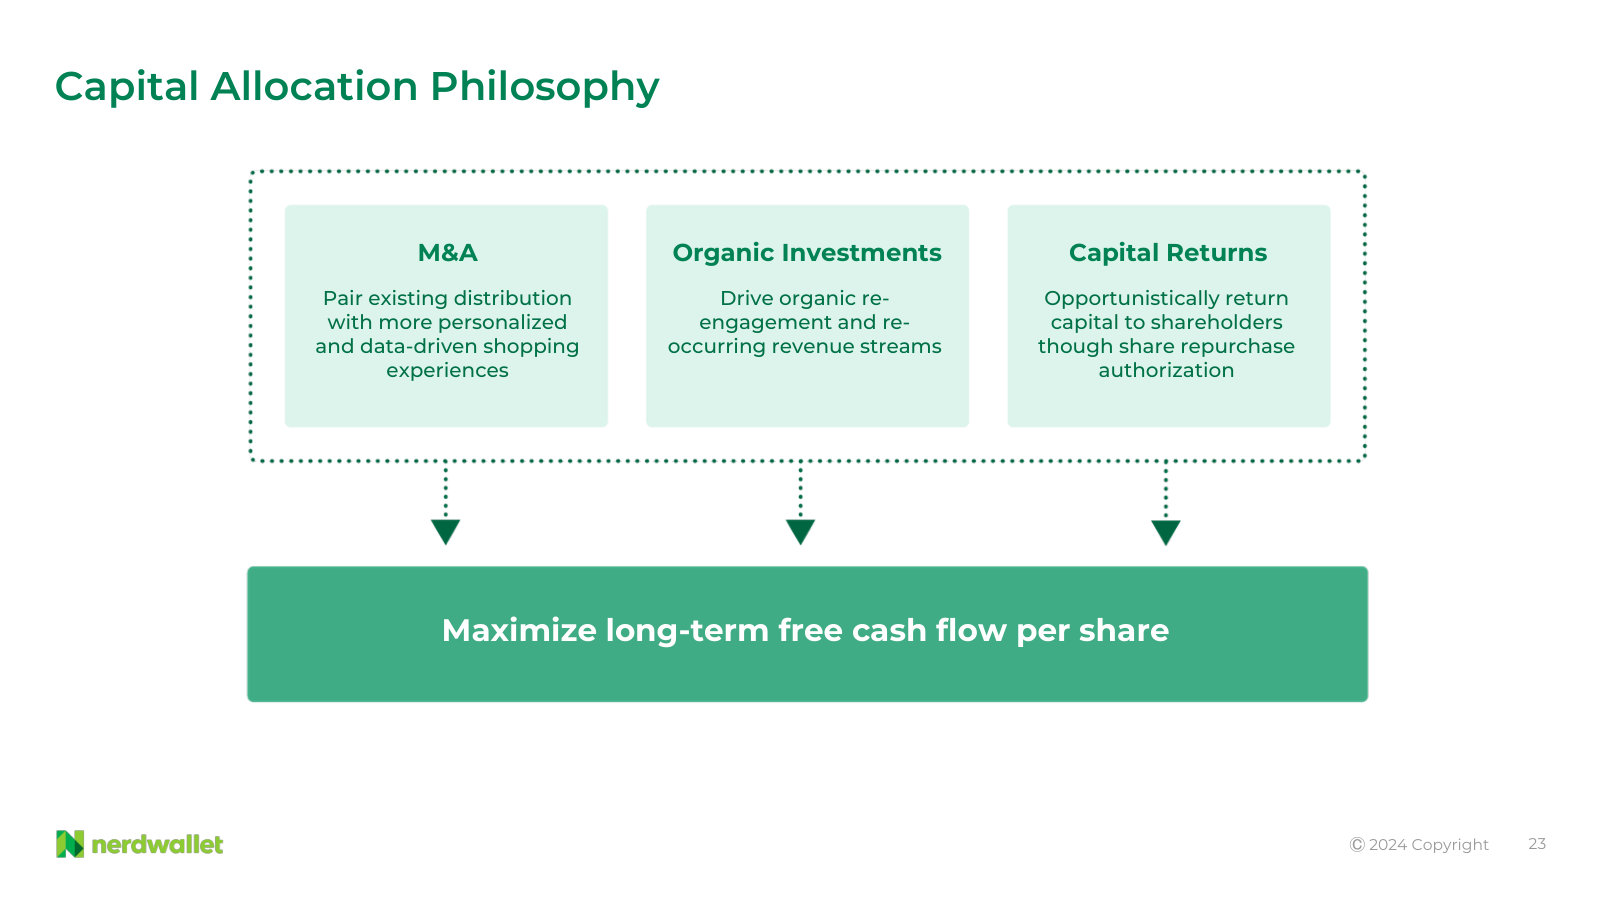
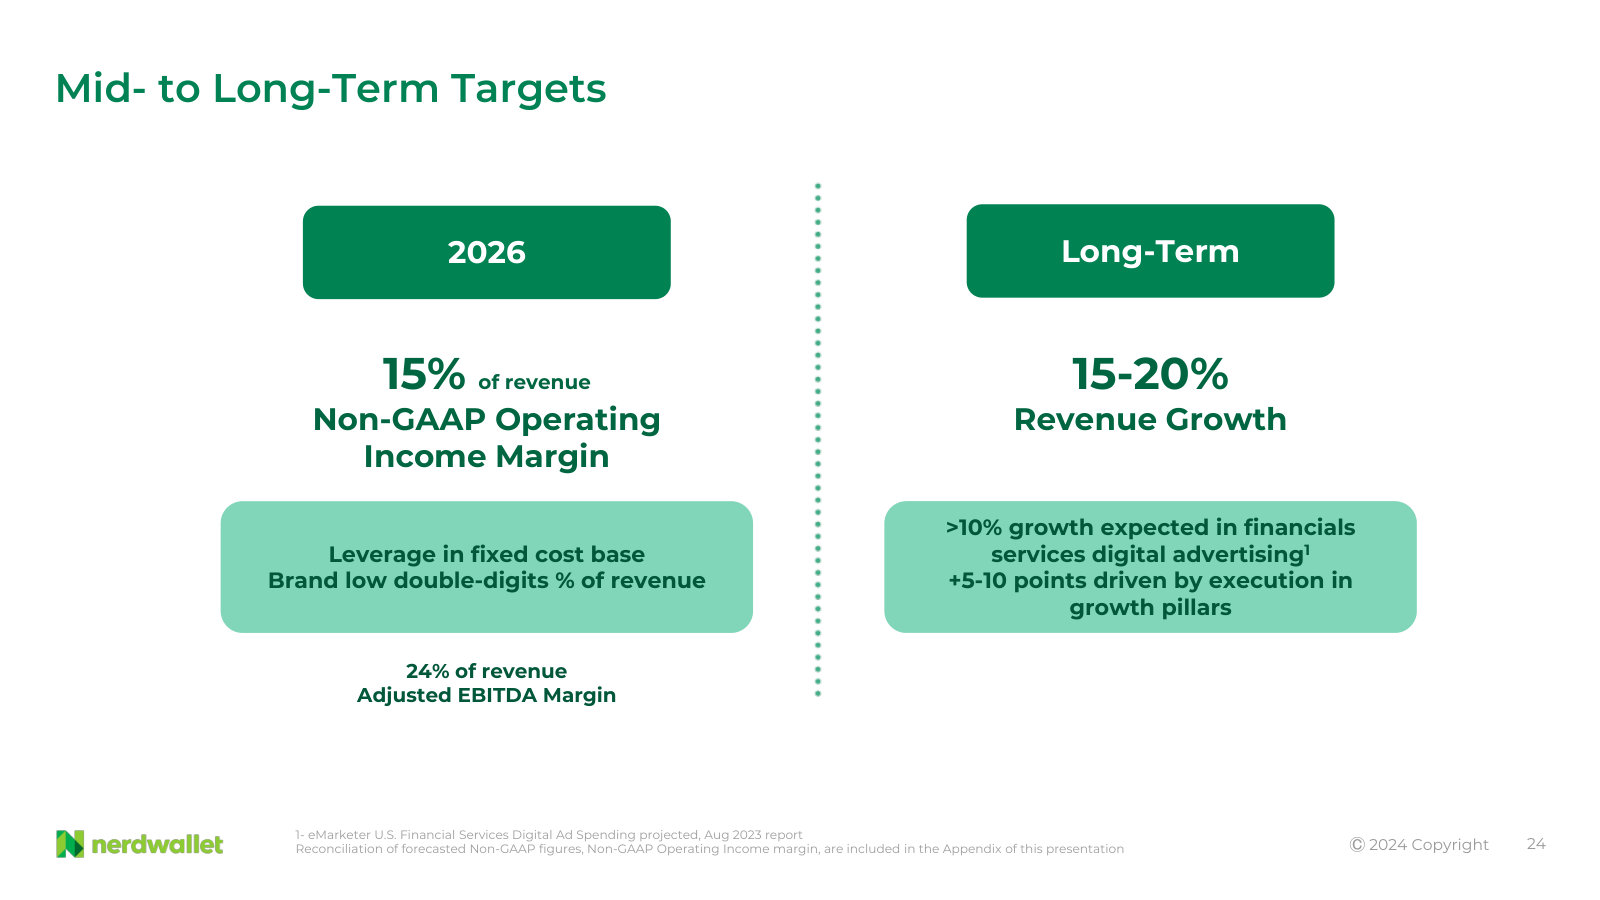
p. 3 — NerdWallet at a glance: $30B+ addressable market, 23M monthly unique users, $599M 2023 revenue, 27% revenue CAGR since 2019. · Open the full presentation →p. 6 — Timeline from 2009 card content through vertical expansion, the Fundera and On the Barrelhead acquisitions, and the 2021 IPO. · Open the full presentation →p. 8 — The product in three motions — Learn, Shop, Manage — showing how free content feeds the marketplaces that earn the revenue. · Open the full presentation →p. 9 — The four growth pillars: single-vertical start, land and expand, vertical integration, then registrations and data-driven engagement. · Open the full presentation →p. 10 — Market map: $30B+ US financial services digital ad spend, $4B+ of it in comparison marketplaces, NerdWallet at $599M. · Open the full presentation →p. 11 — Revenue indexed to 2019 against LendingTree, QuinStreet, EverQuote and MediaAlpha — the share-gain claim in one chart. · Open the full presentation →p. 12 — Where management places itself: brand and trust rather than arbitrage, aimed at multi-product consumers with choice. · Open the full presentation →p. 13 — Brand spend plotted against aided awareness, 42% to 62% over five years — the case for treating marketing as an asset. · Open the full presentation →p. 14 — Fundera case study: what owning the SMB marketplace changed in the funnel, with repeat-rate and revenue evidence. · Open the full presentation →p. 15 — On the Barrelhead case study: personalized loan matching moved inside the funnel, with a claimed 2x match rate. · Open the full presentation →p. 16 — Repeat-transaction cohort curves, all users versus registered users — the engagement data behind the registration push. · Open the full presentation →p. 17 — Registered users from 5.5M to 19M, with lifetime value 5x an unregistered visitor. The core unit-economics slide. · Open the full presentation →p. 19 — Monthly unique users by year and by quarter, with management's explanation of what drove each period. · Open the full presentation →p. 20 — Revenue by vertical 2021-2023 — credit cards, loans, SMB products, emerging verticals — and why the mix shifted. · Open the full presentation →p. 21 — Cost base as a percentage of revenue, and the split of sales & marketing into variable performance marketing versus fixed brand and organic. · Open the full presentation →p. 22 — Adjusted EBITDA and non-GAAP operating margin from 2021 to the 2026 targets — the whole margin path in one chart. · Open the full presentation →p. 23 — Capital allocation: M&A, organic investment and buybacks, framed against long-term free cash flow per share. · Open the full presentation →p. 24 — The 2026 targets — 15% non-GAAP operating margin, 24% adjusted EBITDA margin — plus 15-20% long-term revenue growth. · Open the full presentation →
The most recent results letter, and the first under the simplified Consumer / SMB reporting split; also states the current AI-era investment thesis. · Open the full document →
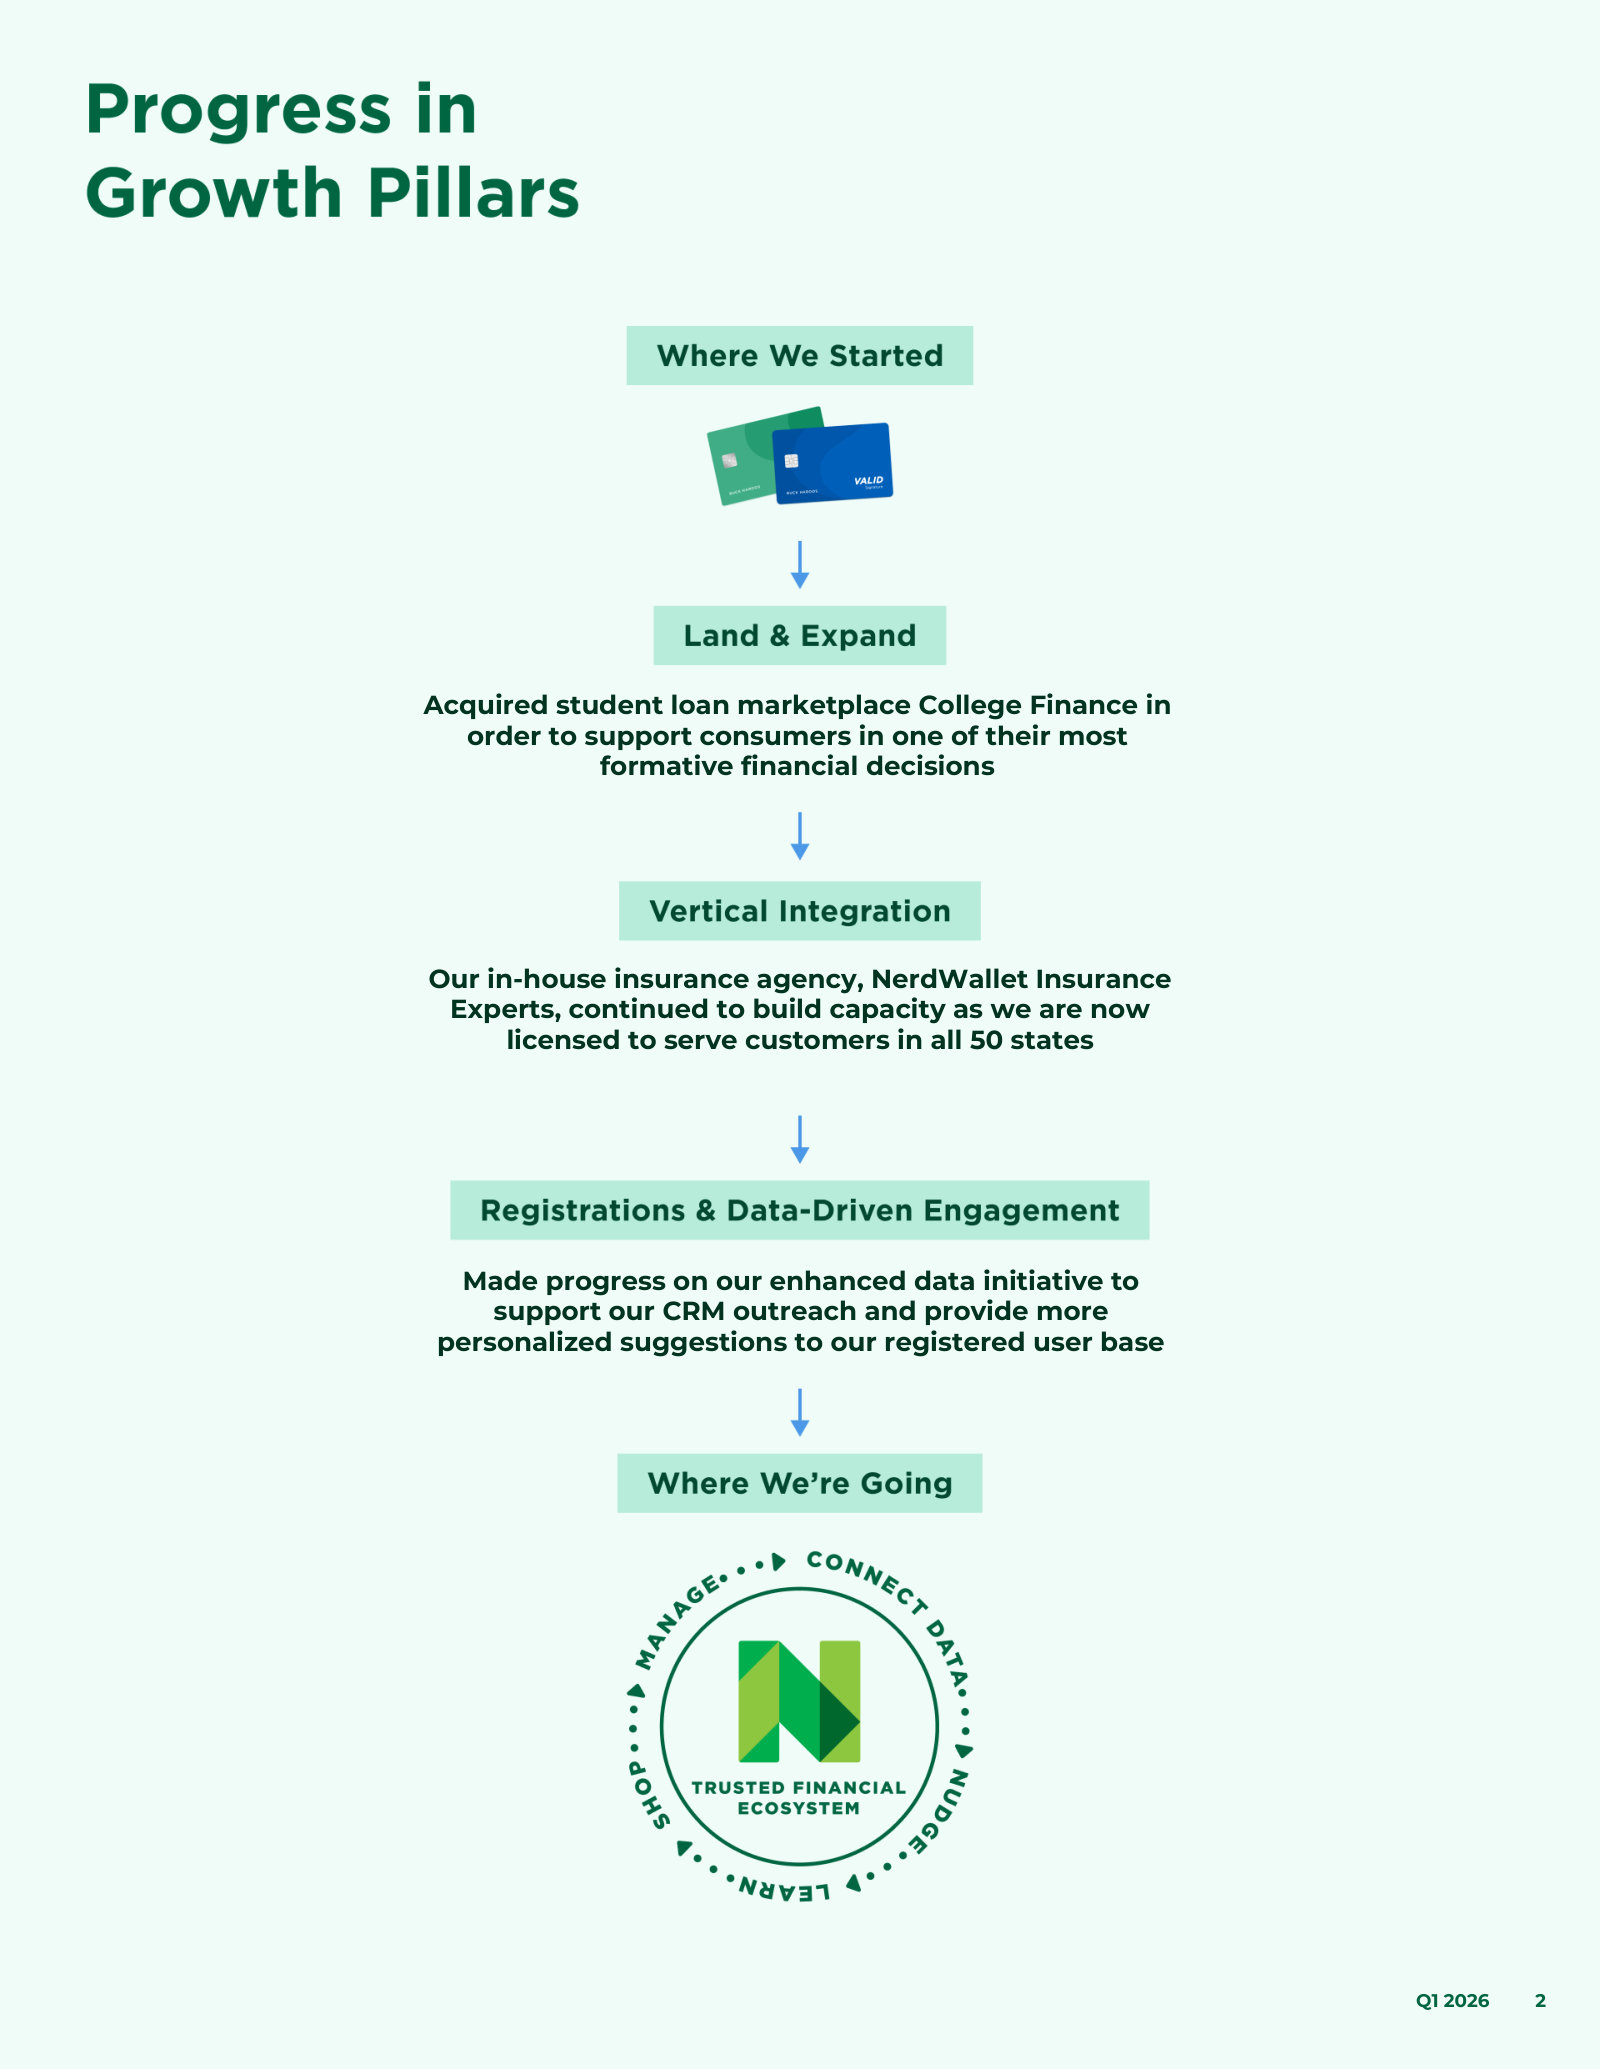
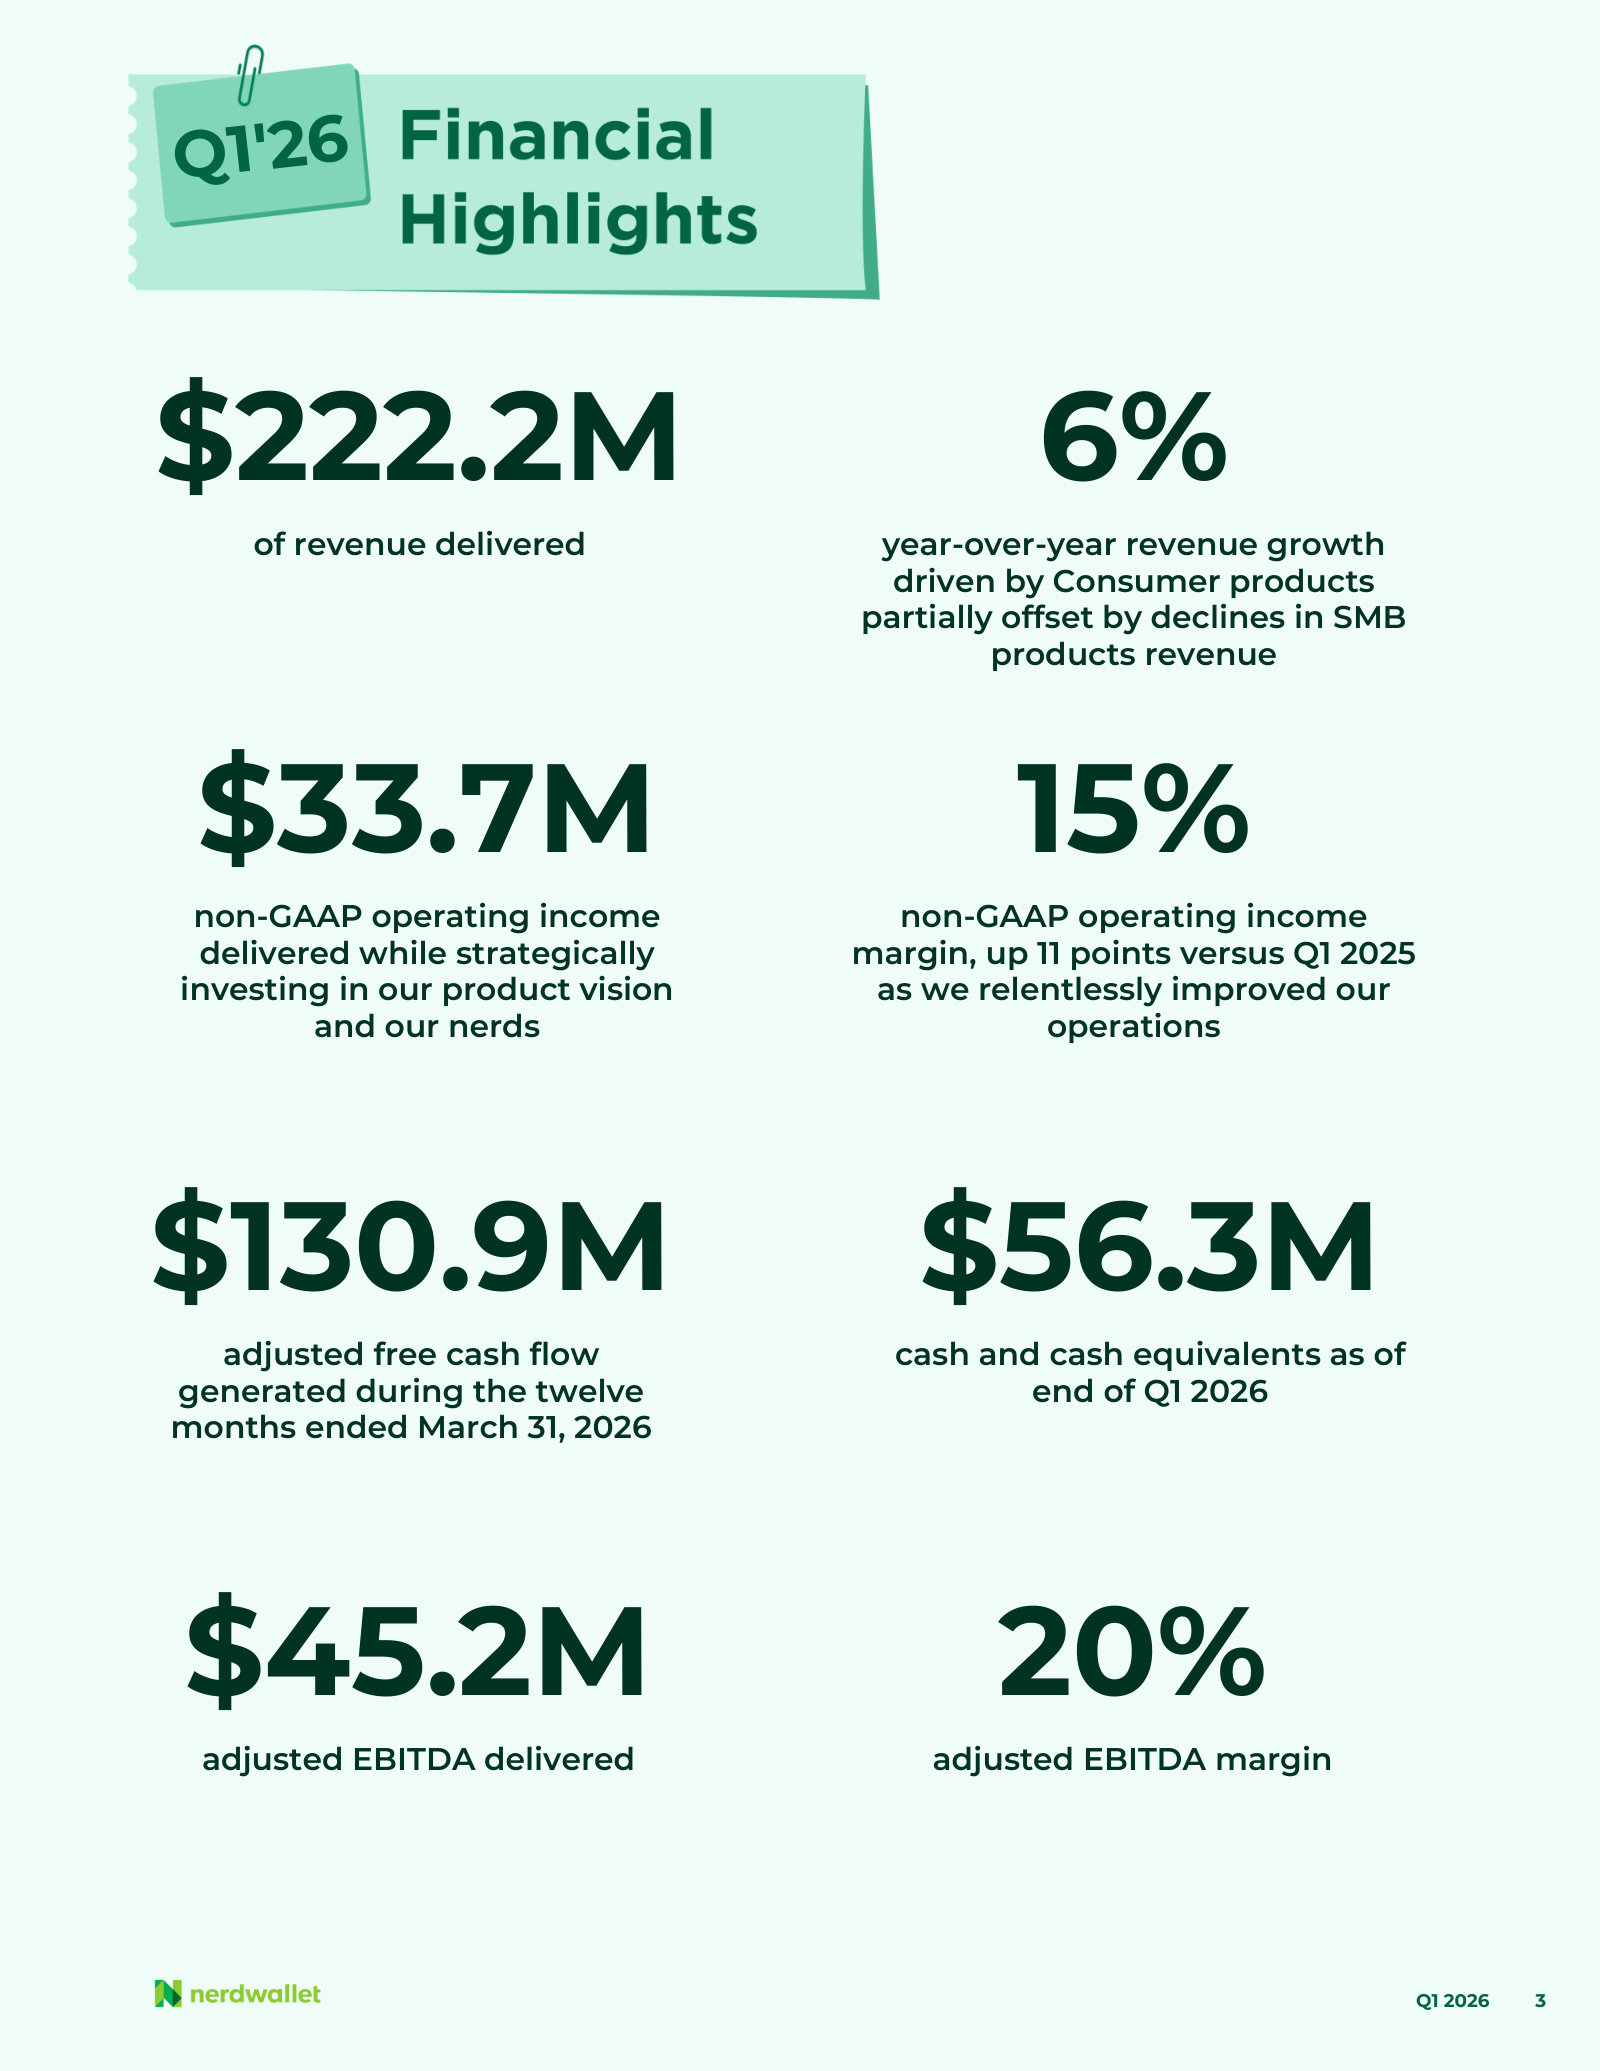
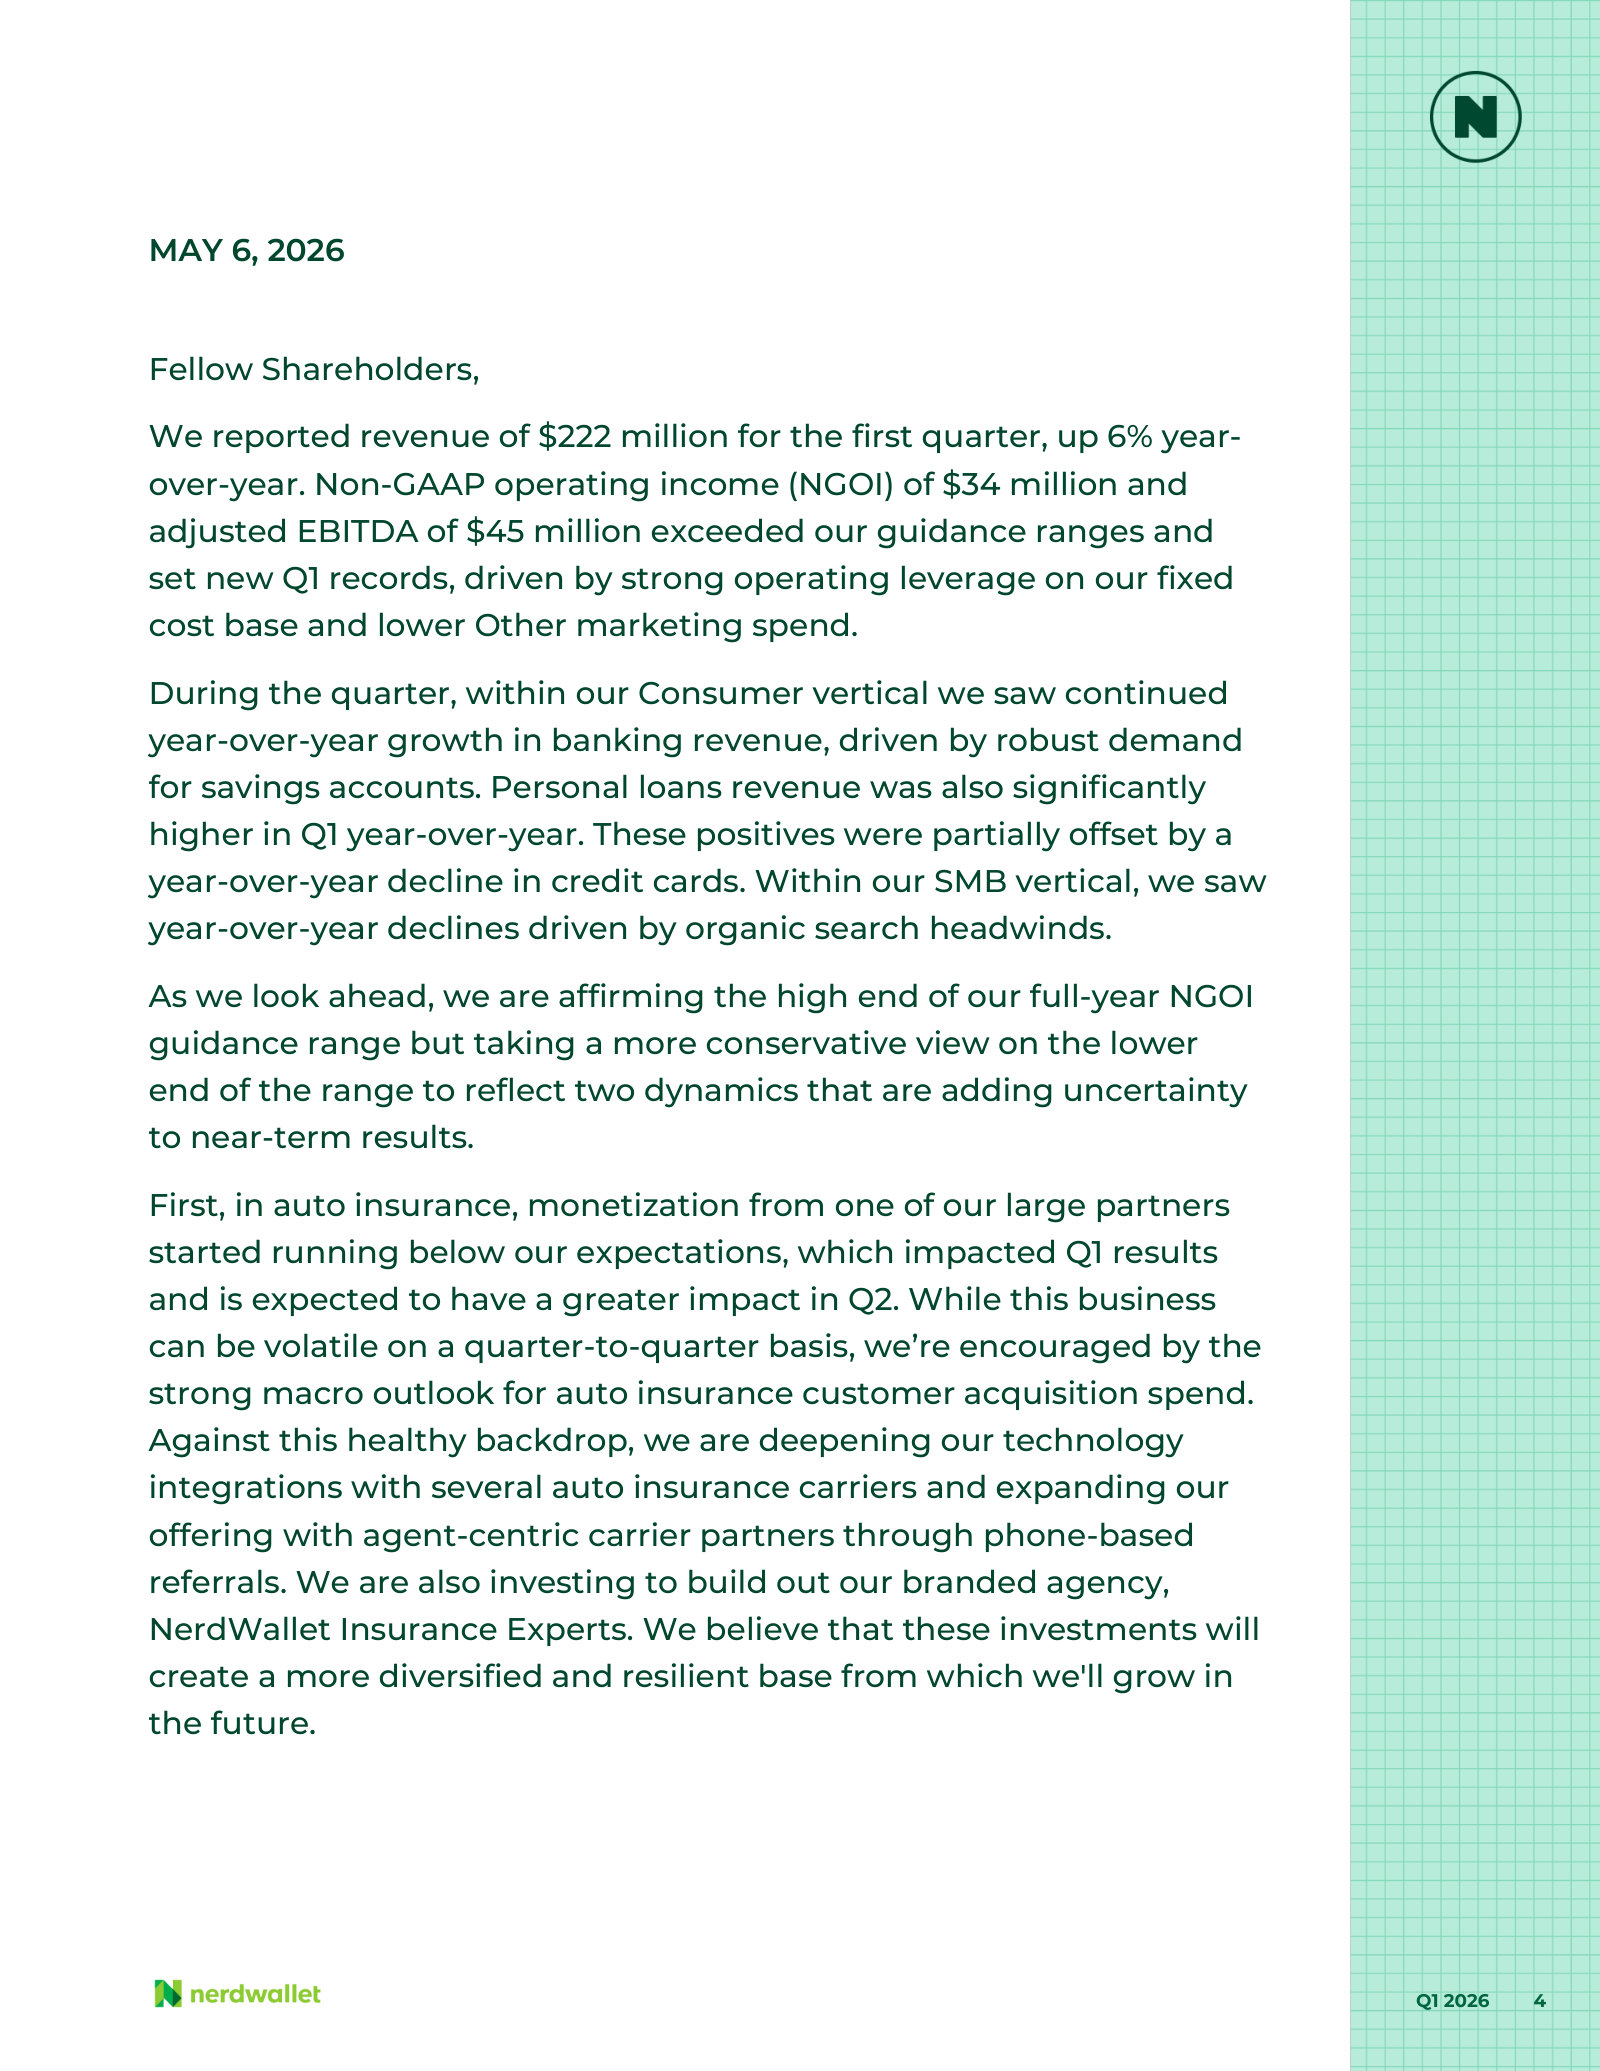
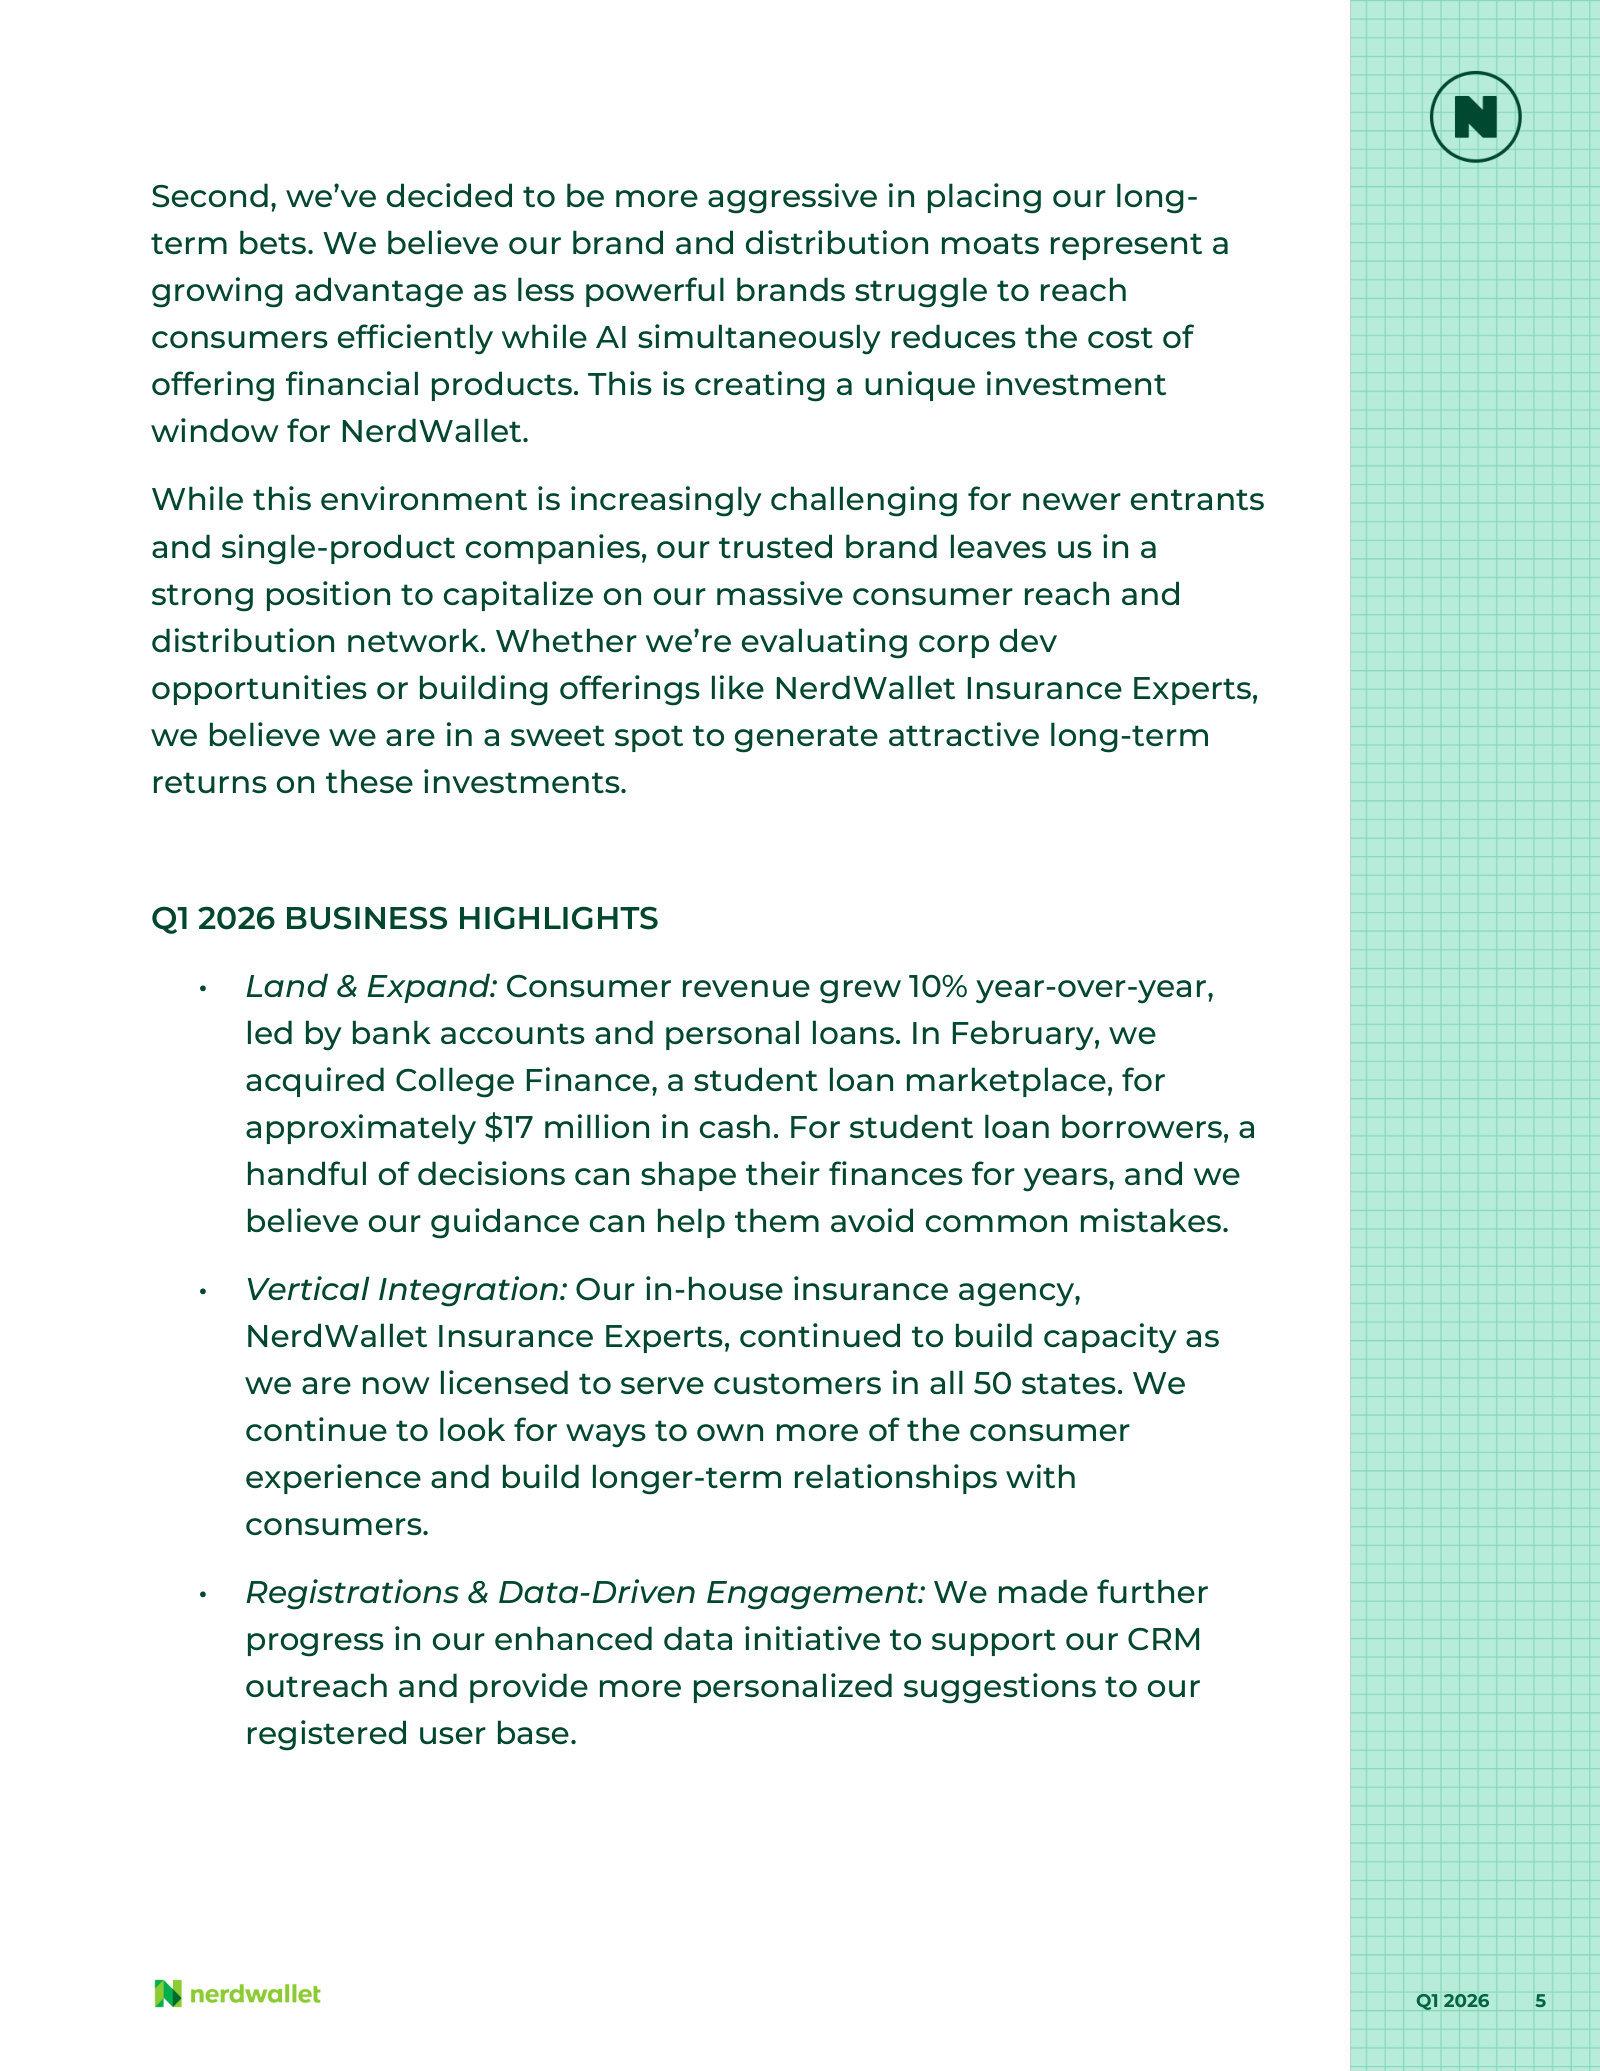
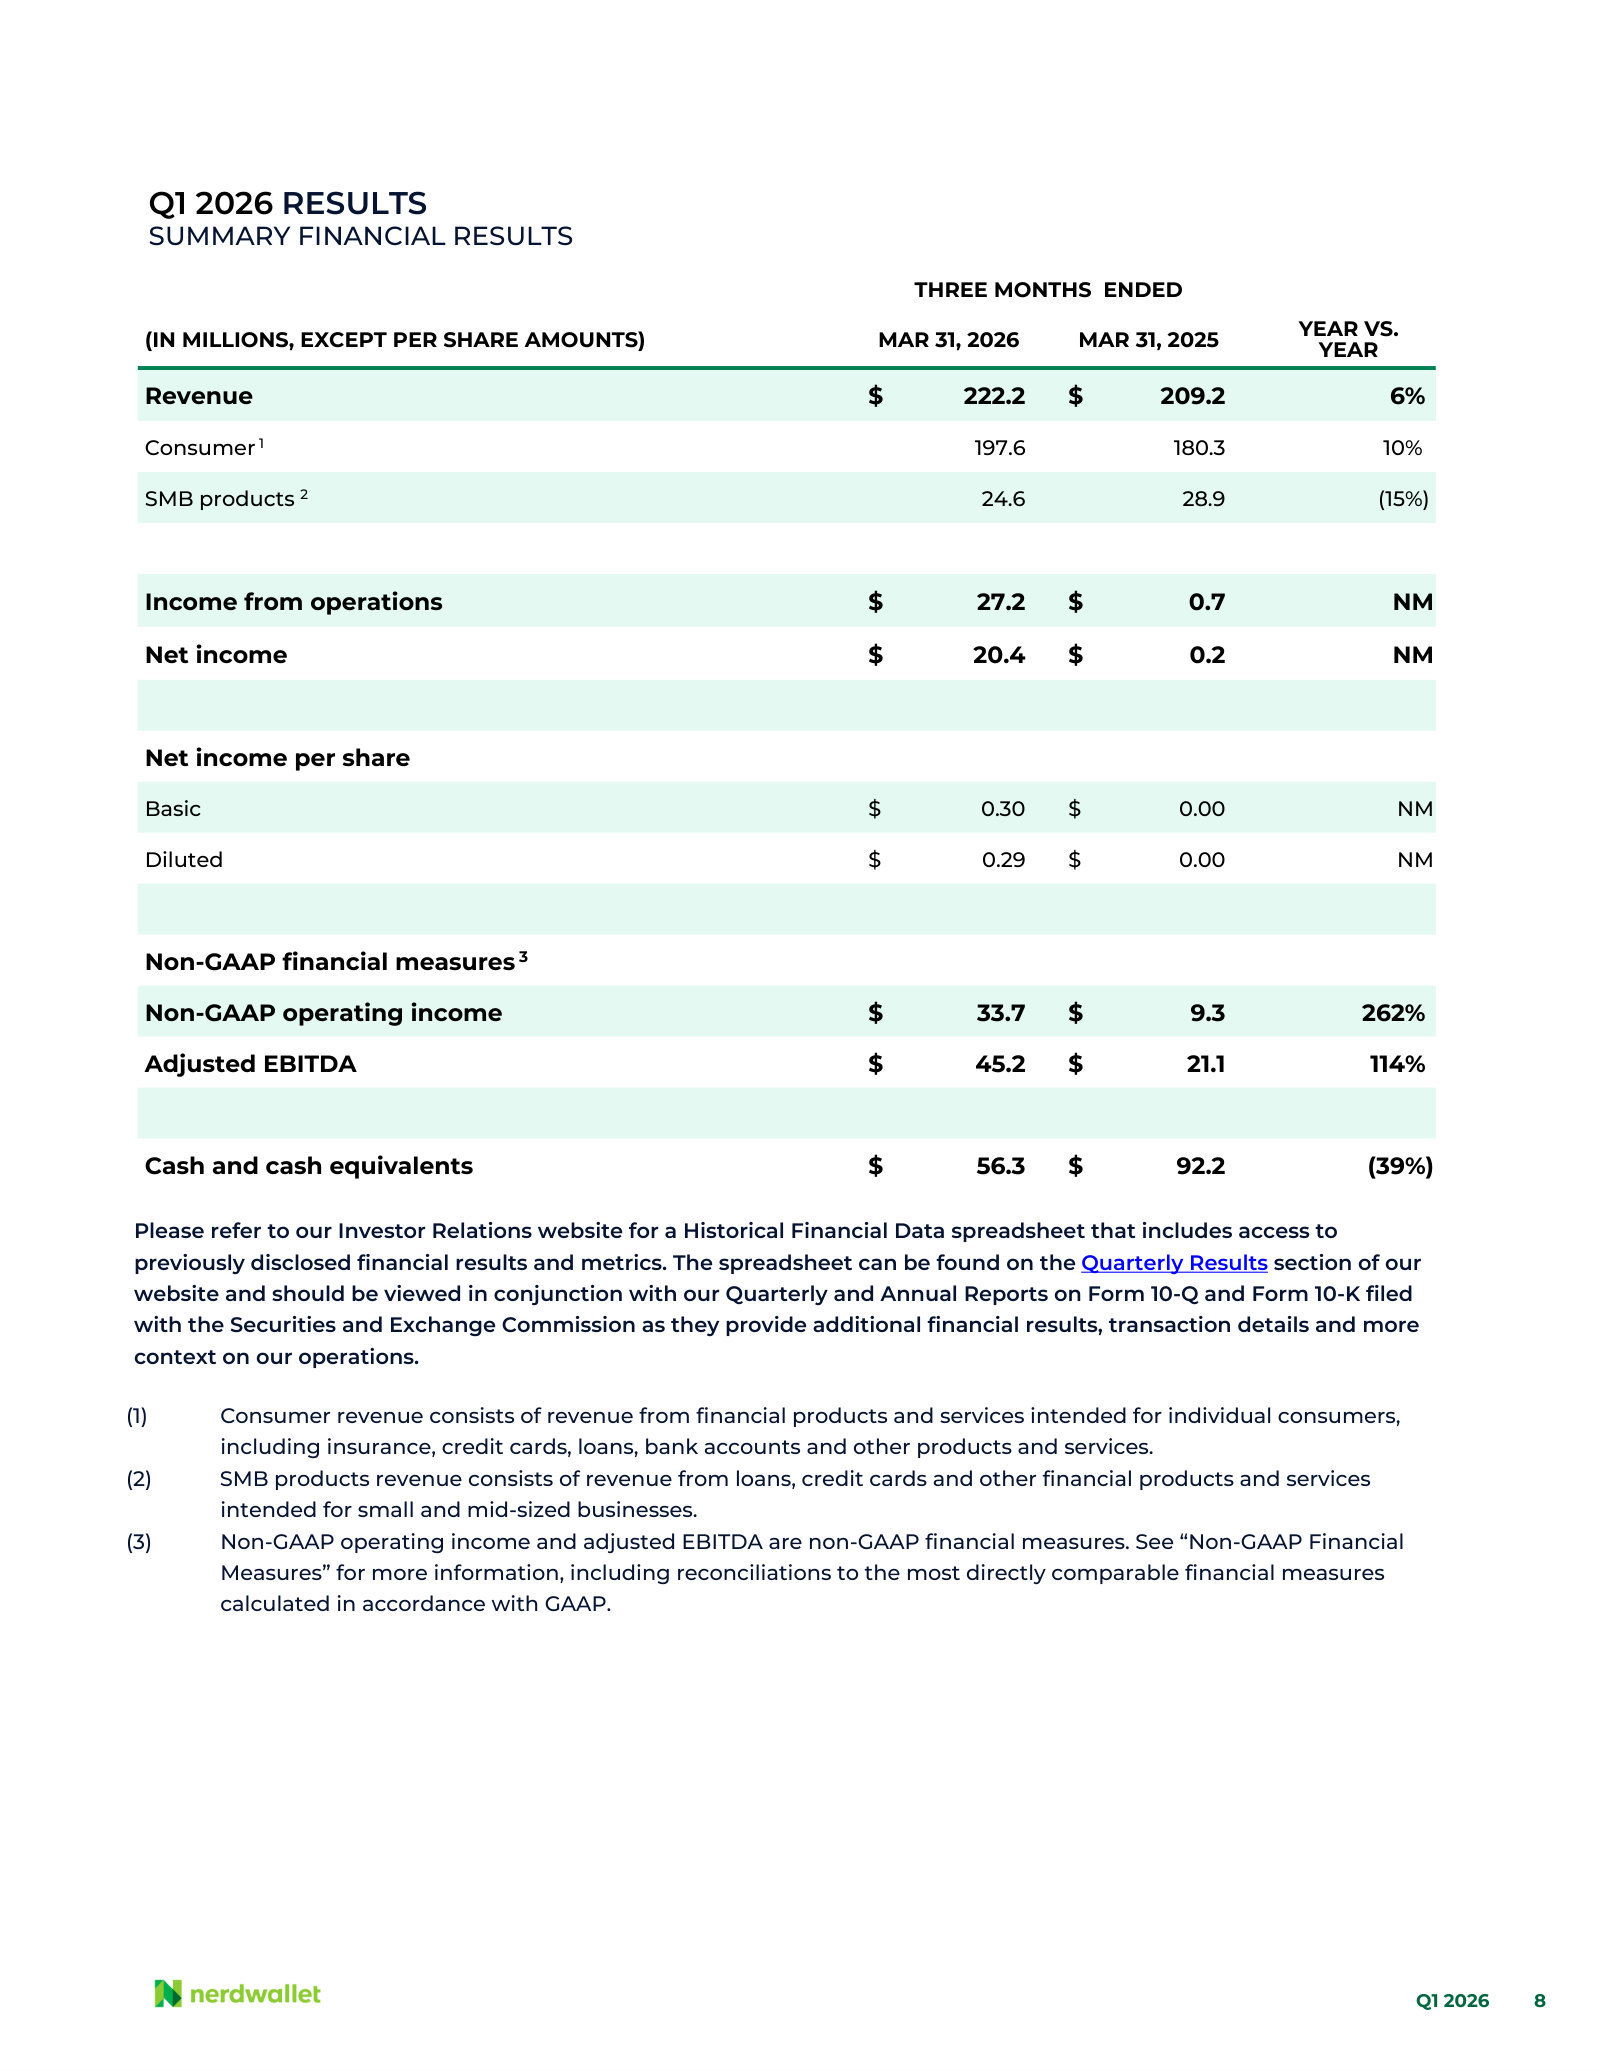
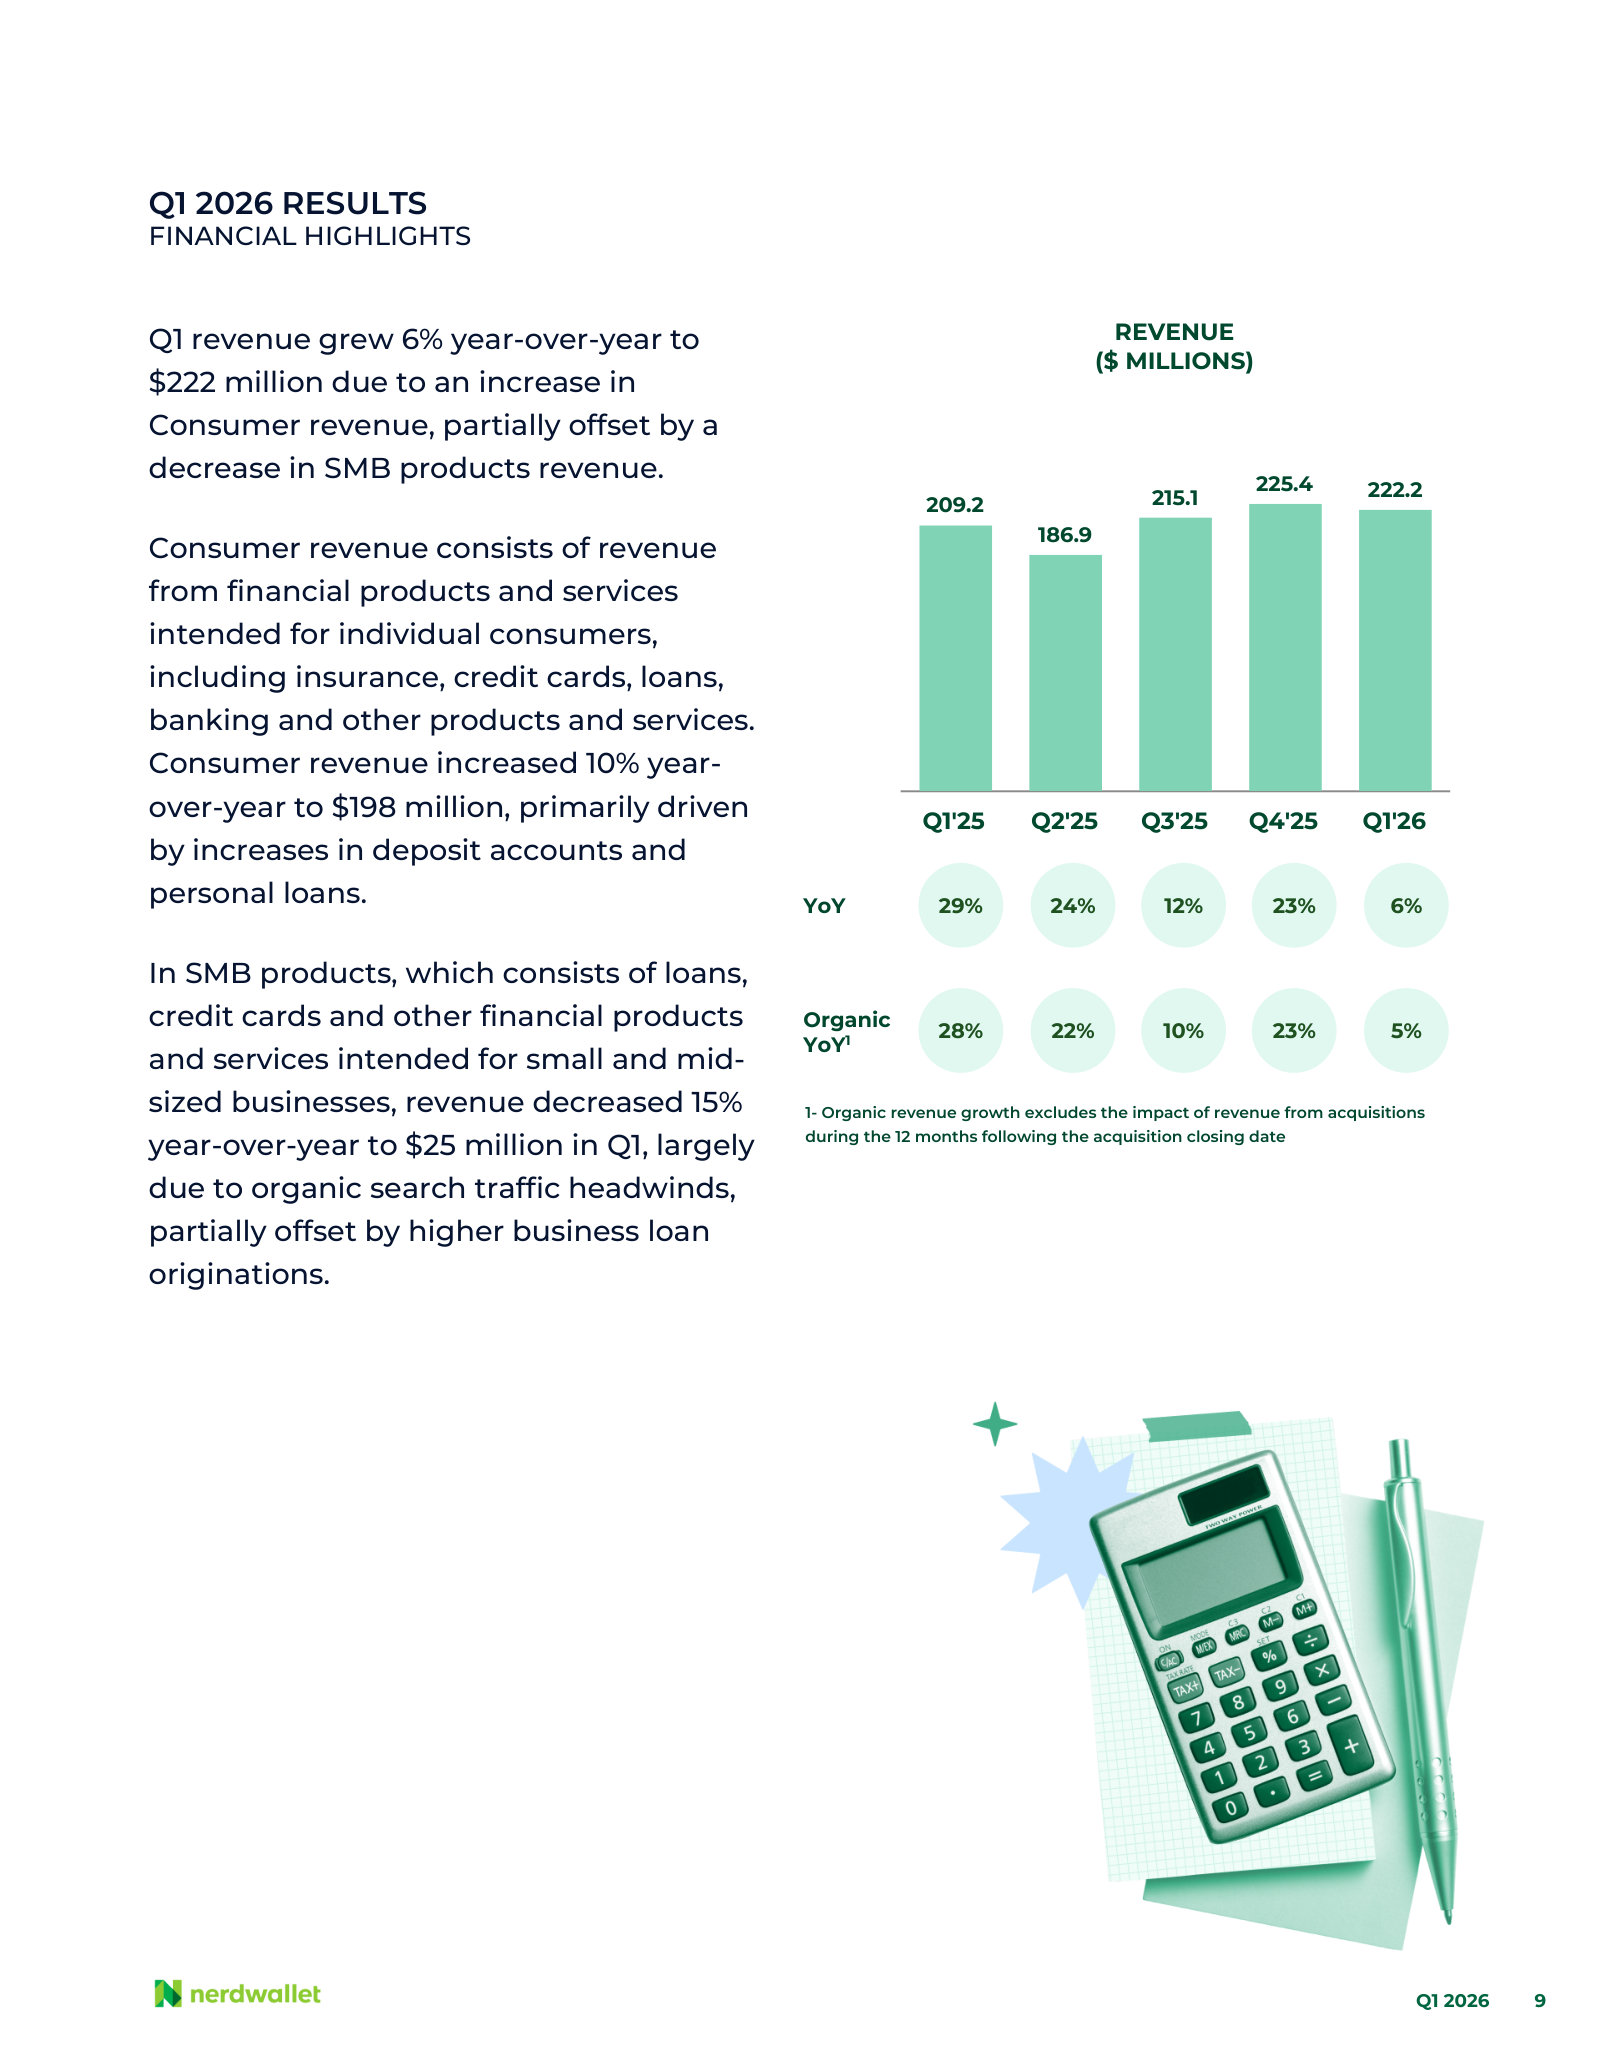
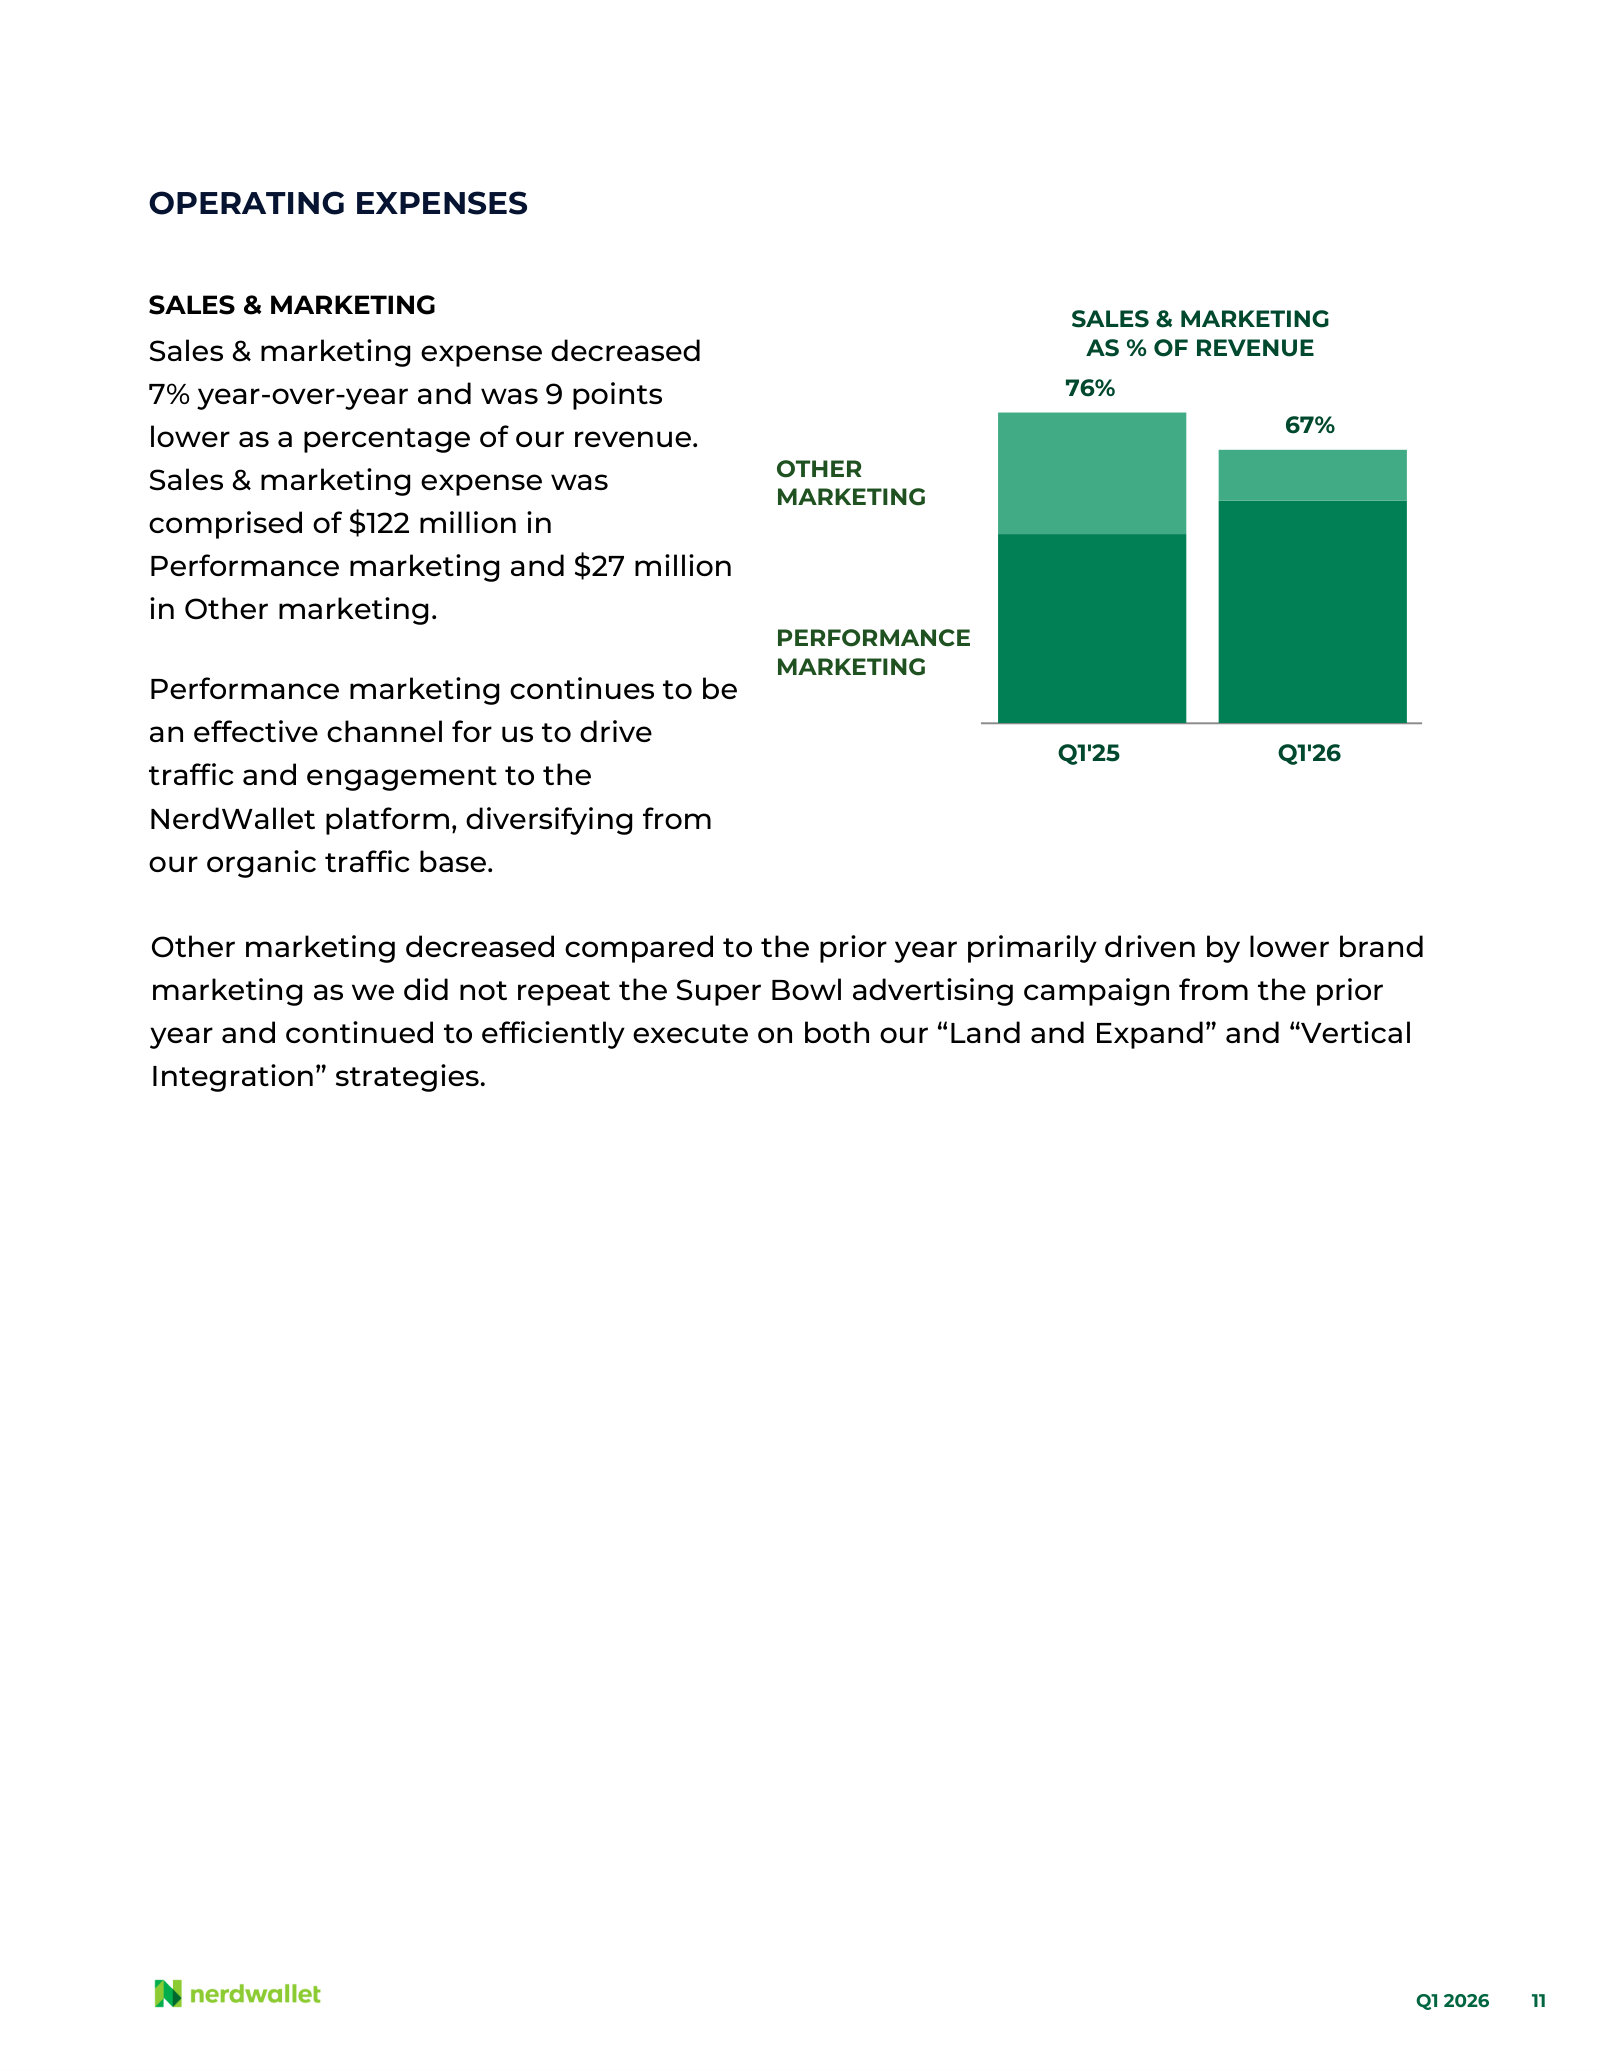
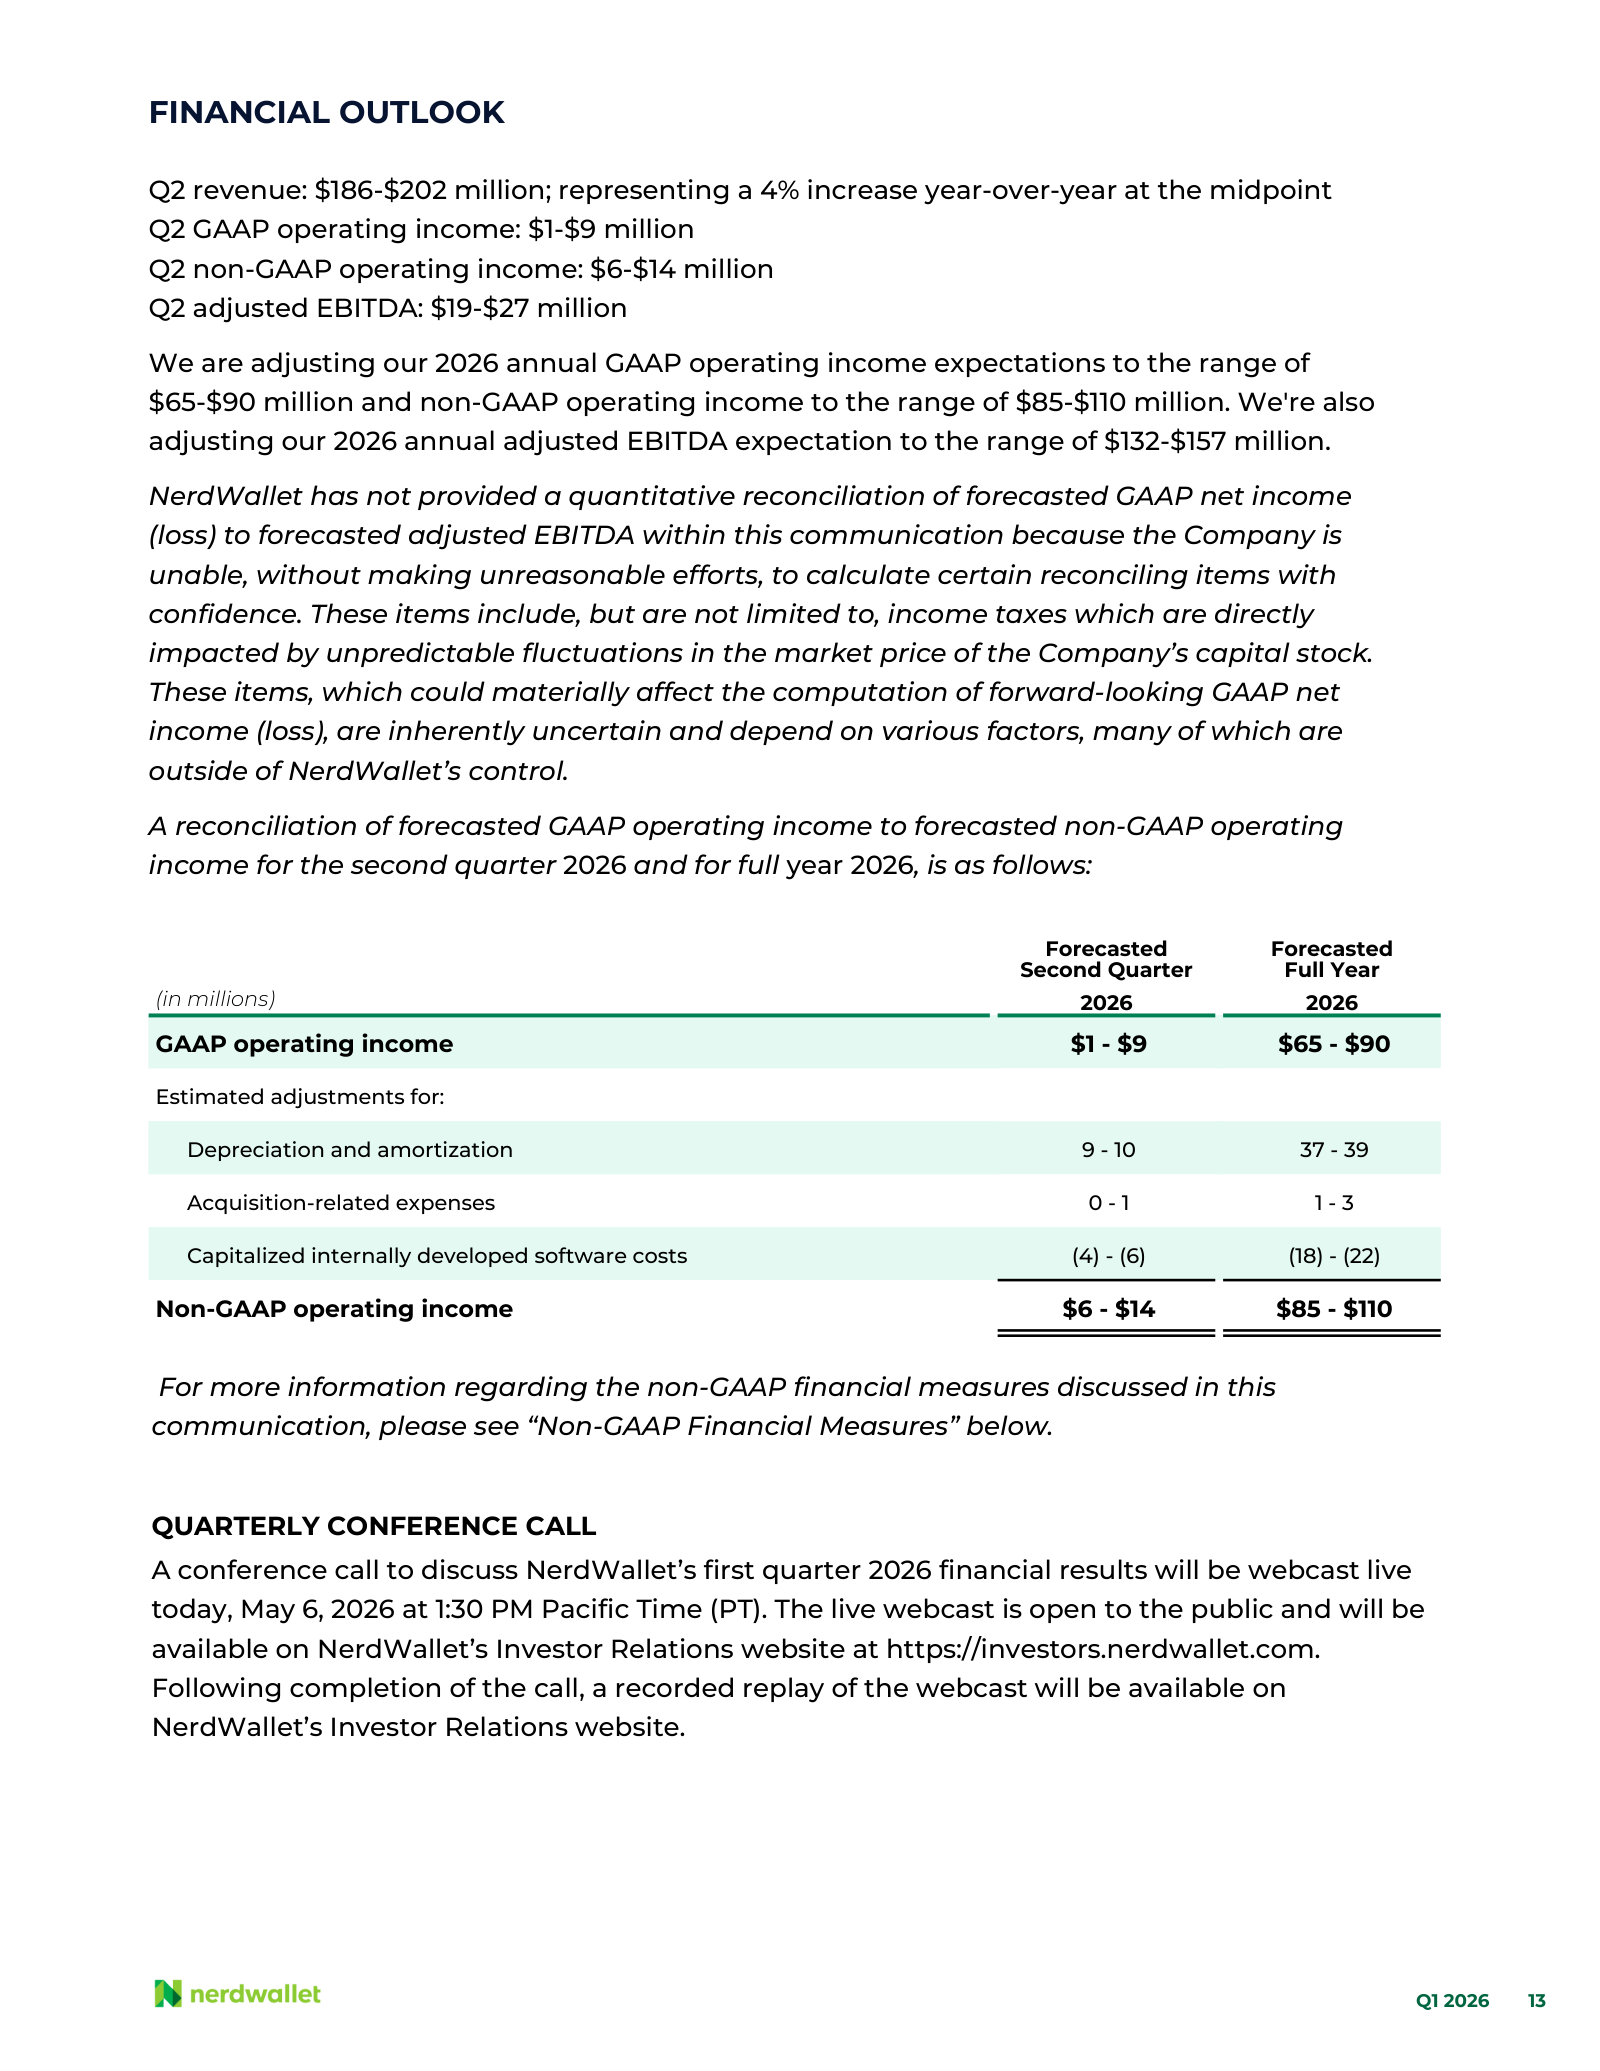
p. 2 — Growth-pillar progress this quarter: College Finance acquired, the in-house insurance agency now licensed in all 50 states. · Open the full presentation →p. 3 — Q1 2026 in eight numbers: $222M revenue, 15% non-GAAP operating margin, $131M trailing twelve-month adjusted free cash flow. · Open the full presentation →p. 4 — CEO letter: banking and personal loans up, credit cards down, and the auto-insurance partner whose monetization came in short. · Open the full presentation →p. 5 — The current strategic bet — brand and distribution as a widening moat while AI lowers the cost of offering financial products. · Open the full presentation →p. 8 — Summary results on the new two-line basis: Consumer $198M up 10%, SMB products $25M down 15%, with both definitions footnoted. · Open the full presentation →p. 9 — Five quarters of revenue with reported and organic growth rates, plus what Consumer and SMB each contain. · Open the full presentation →p. 11 — Sales & marketing down to 67% of revenue, split between performance marketing and other — nine points of leverage year over year. · Open the full presentation →p. 13 — Q2 and full-year 2026 guidance, with the GAAP-to-non-GAAP operating income bridge. · Open the full presentation →
The full-year 2025 account, and the last letter to report revenue across all five verticals — the most granular view of where the money comes from. · Open the full document →
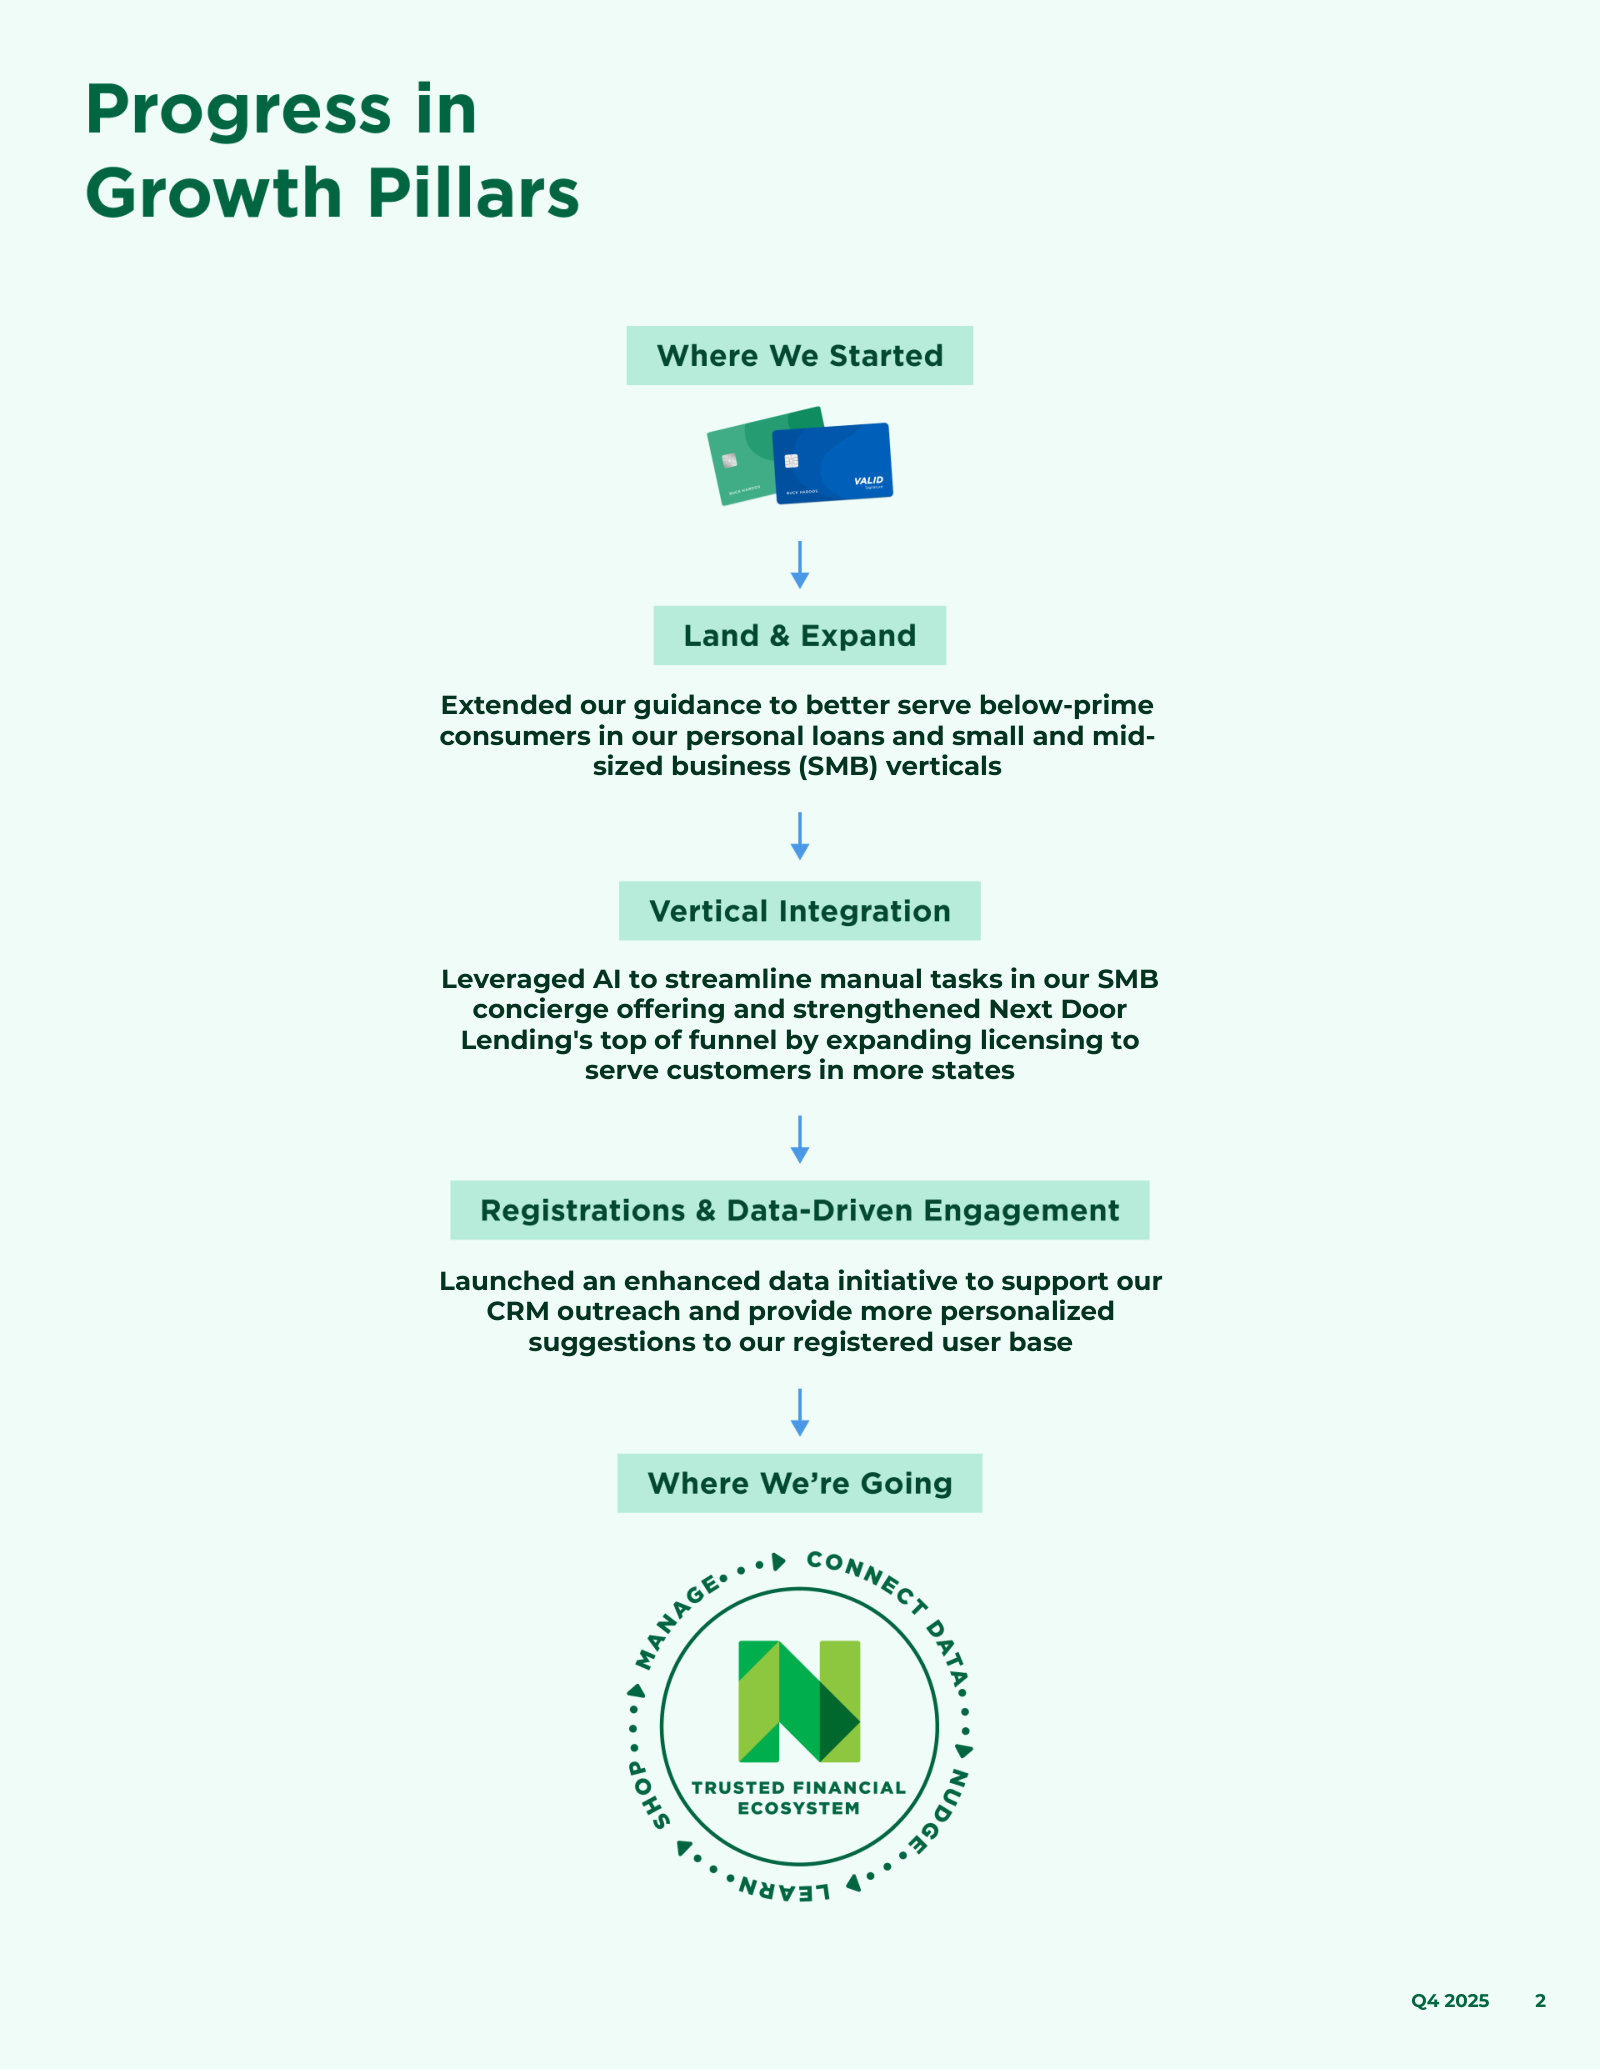
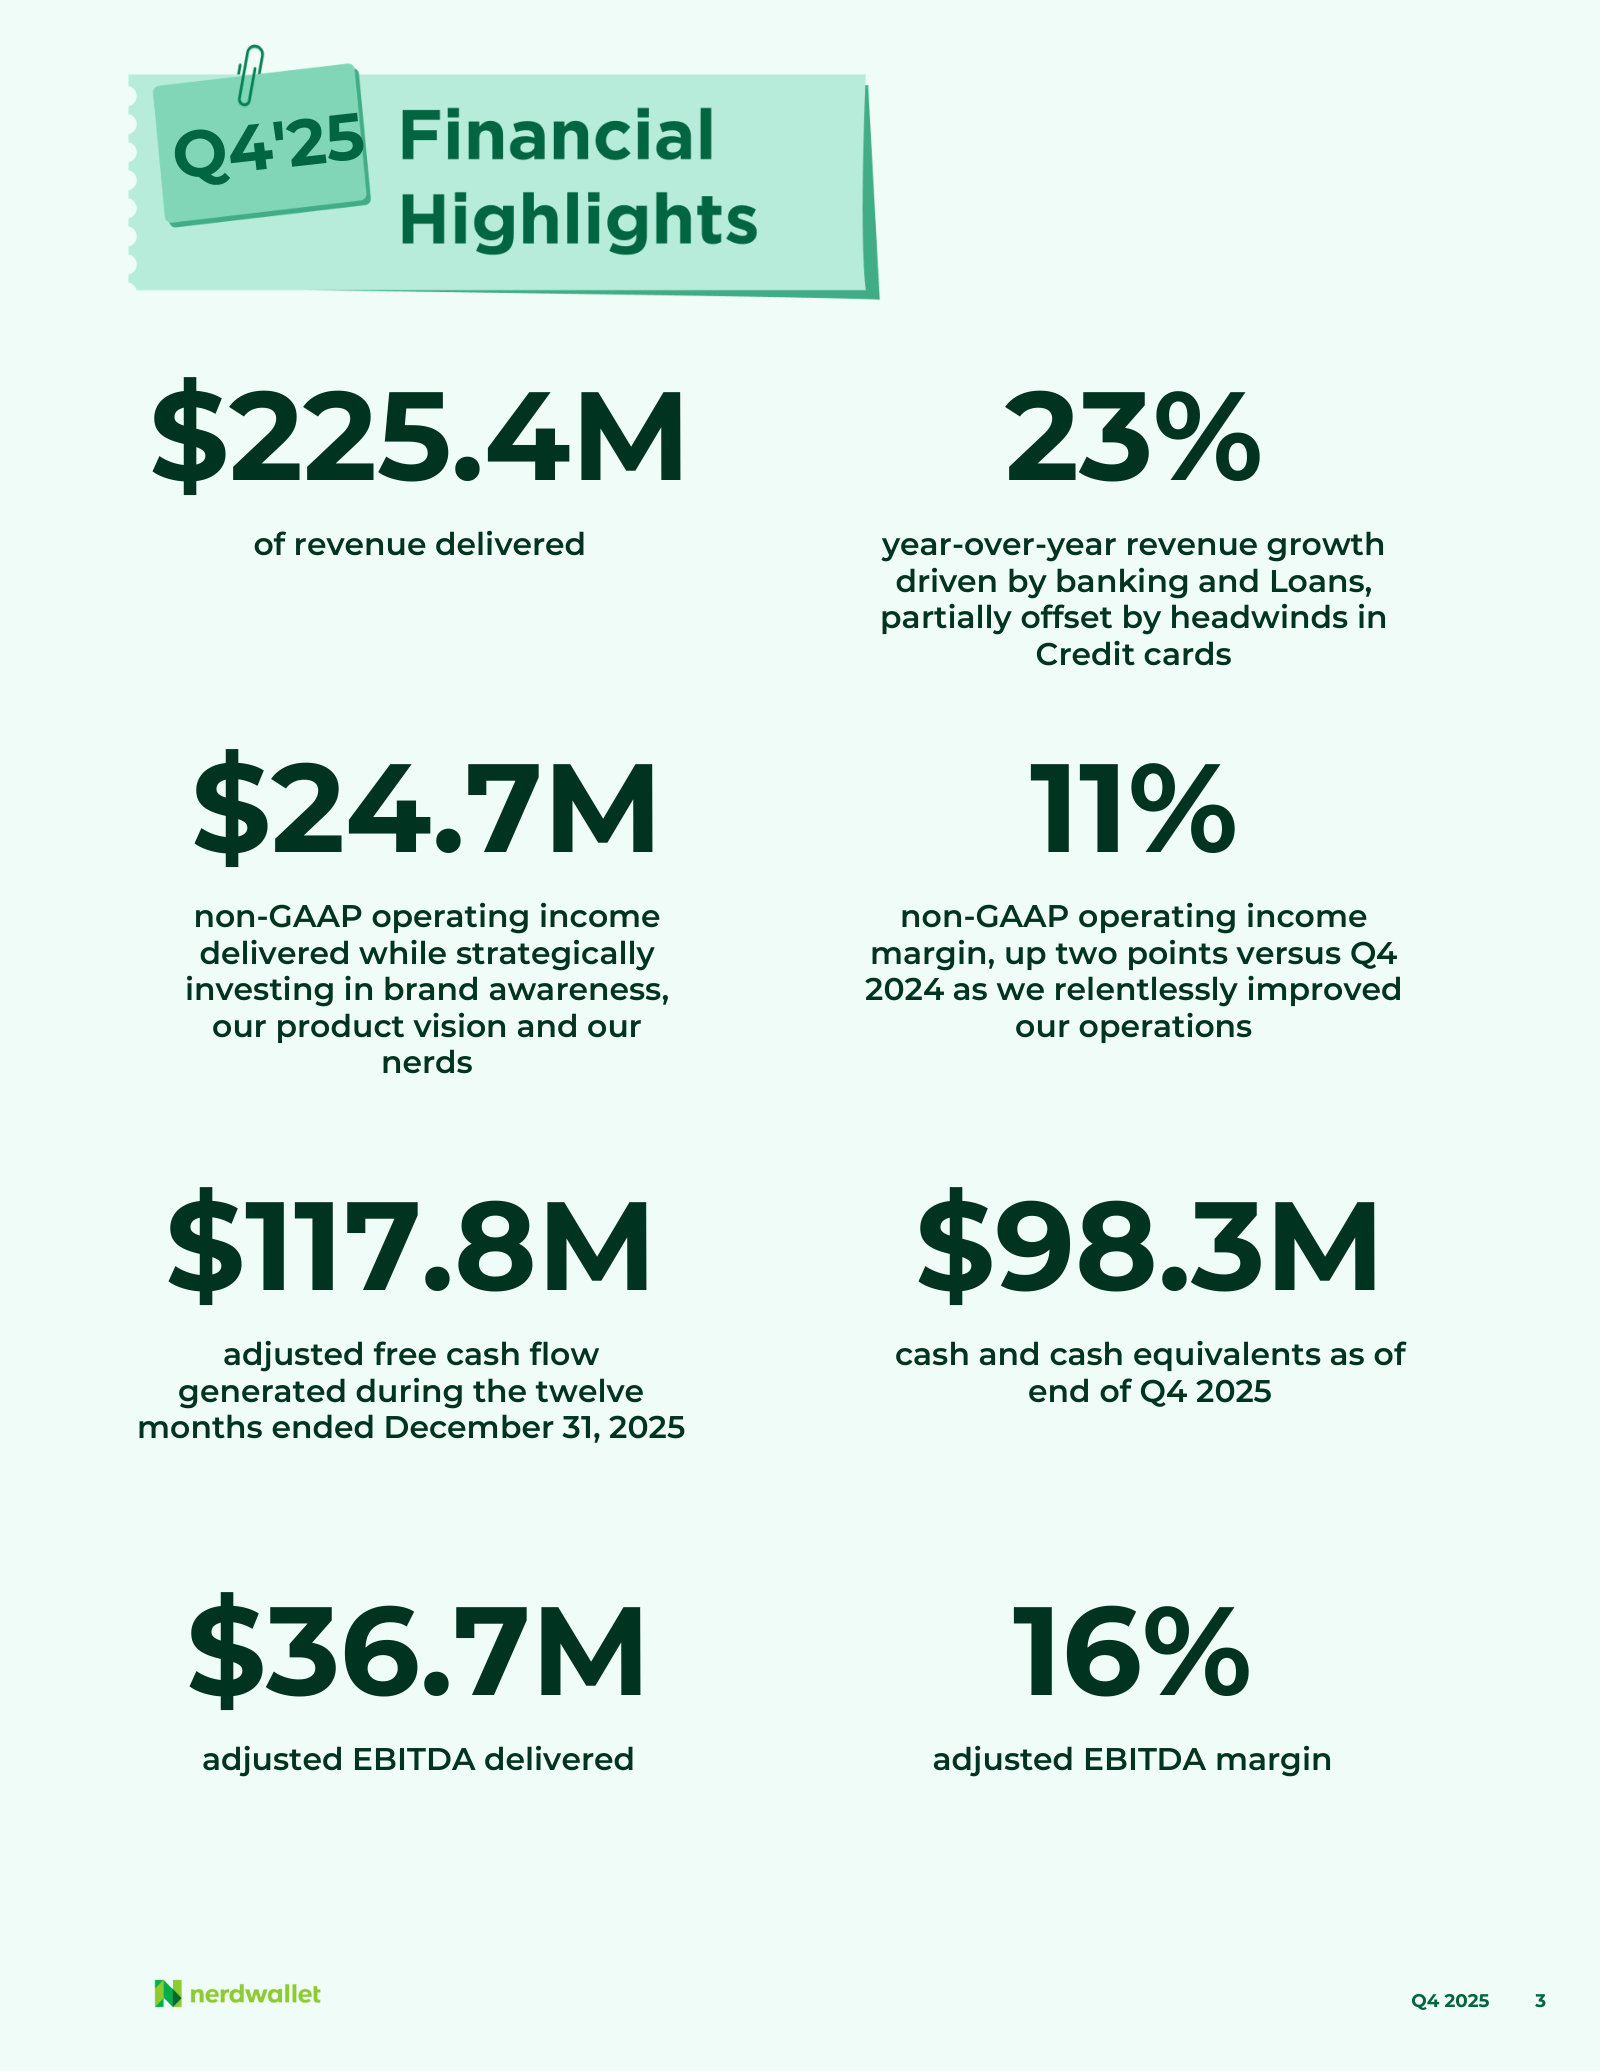
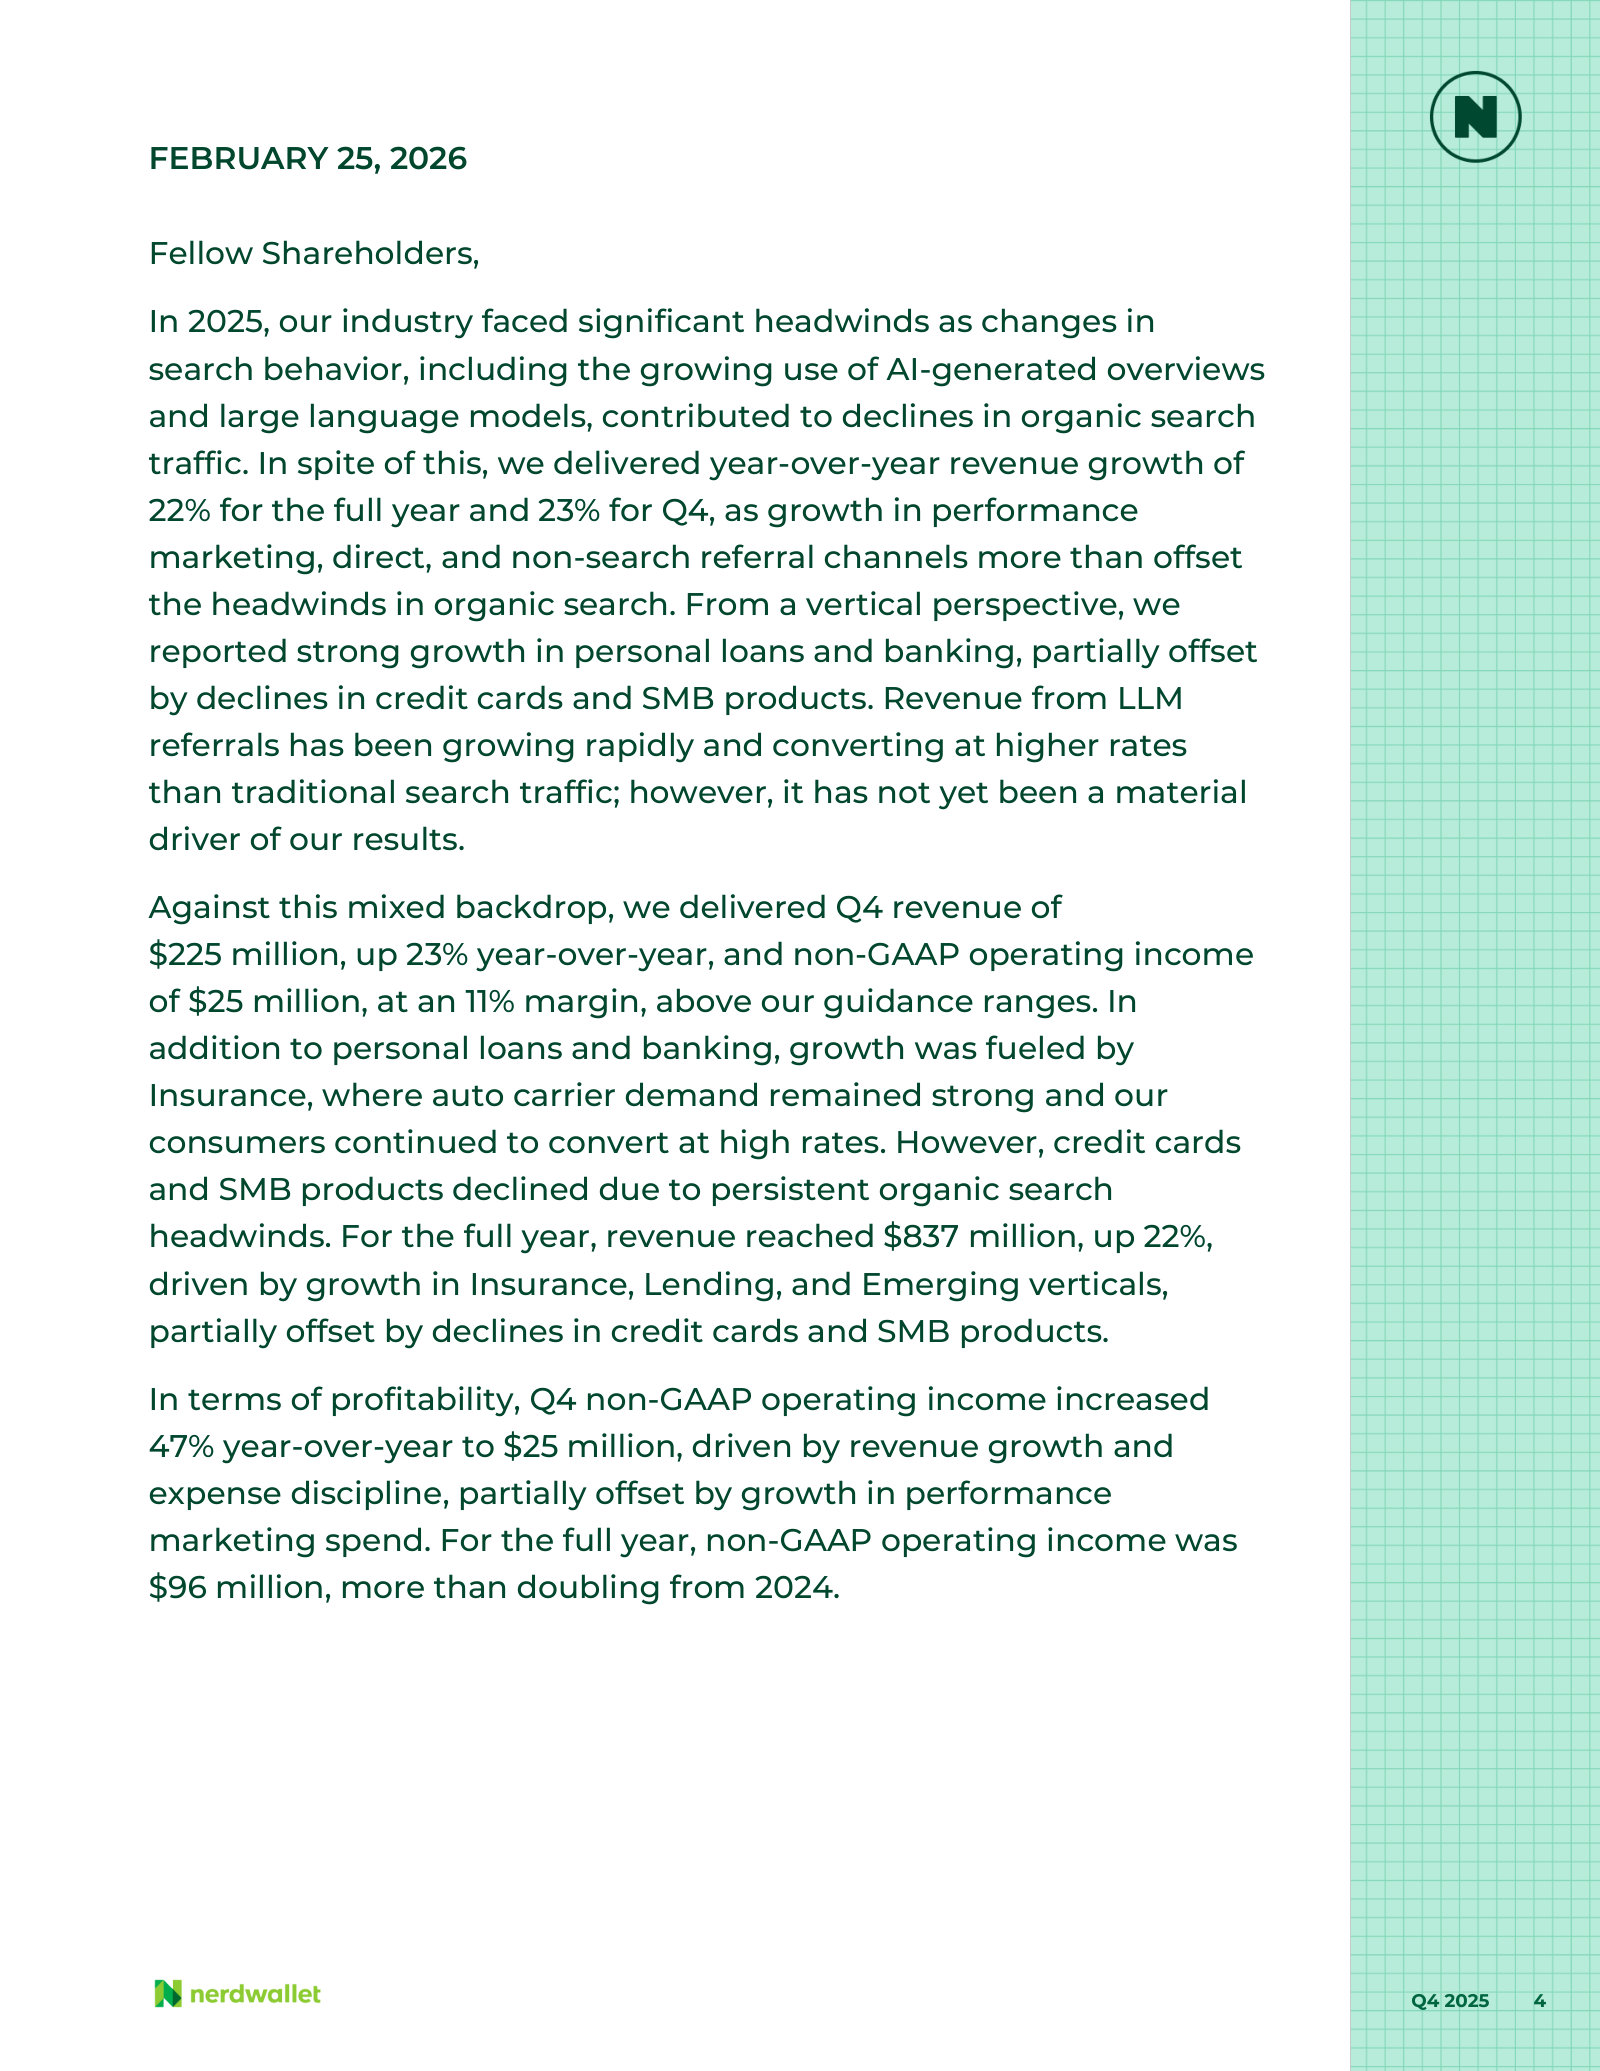
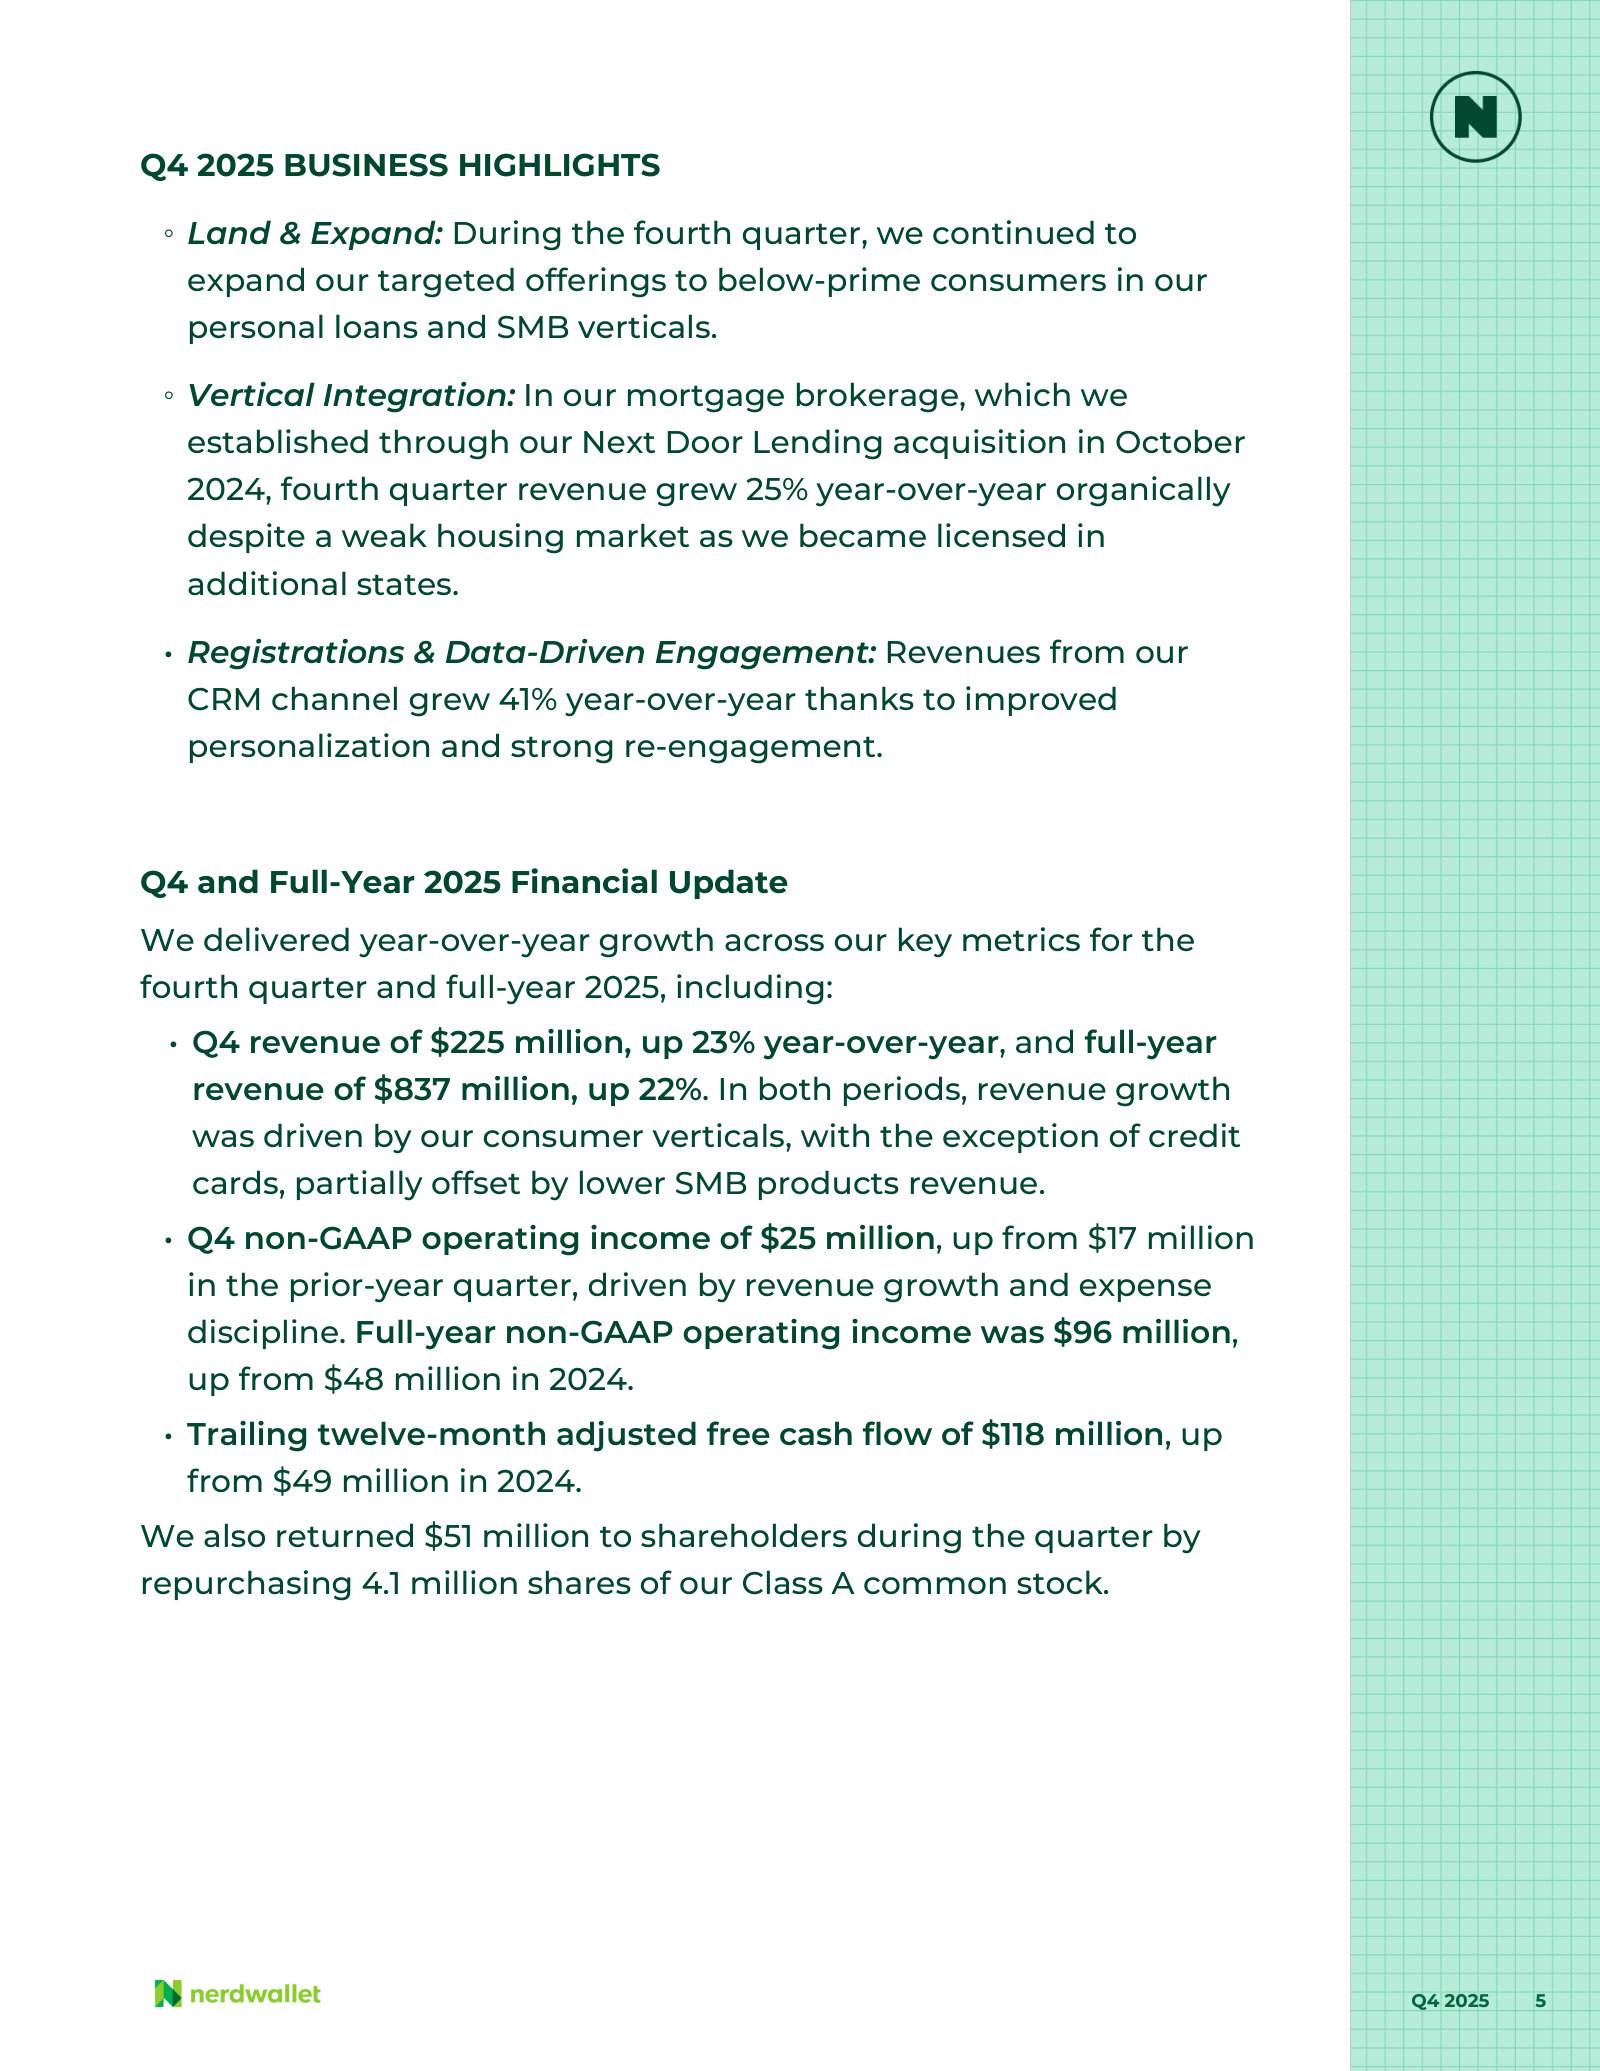
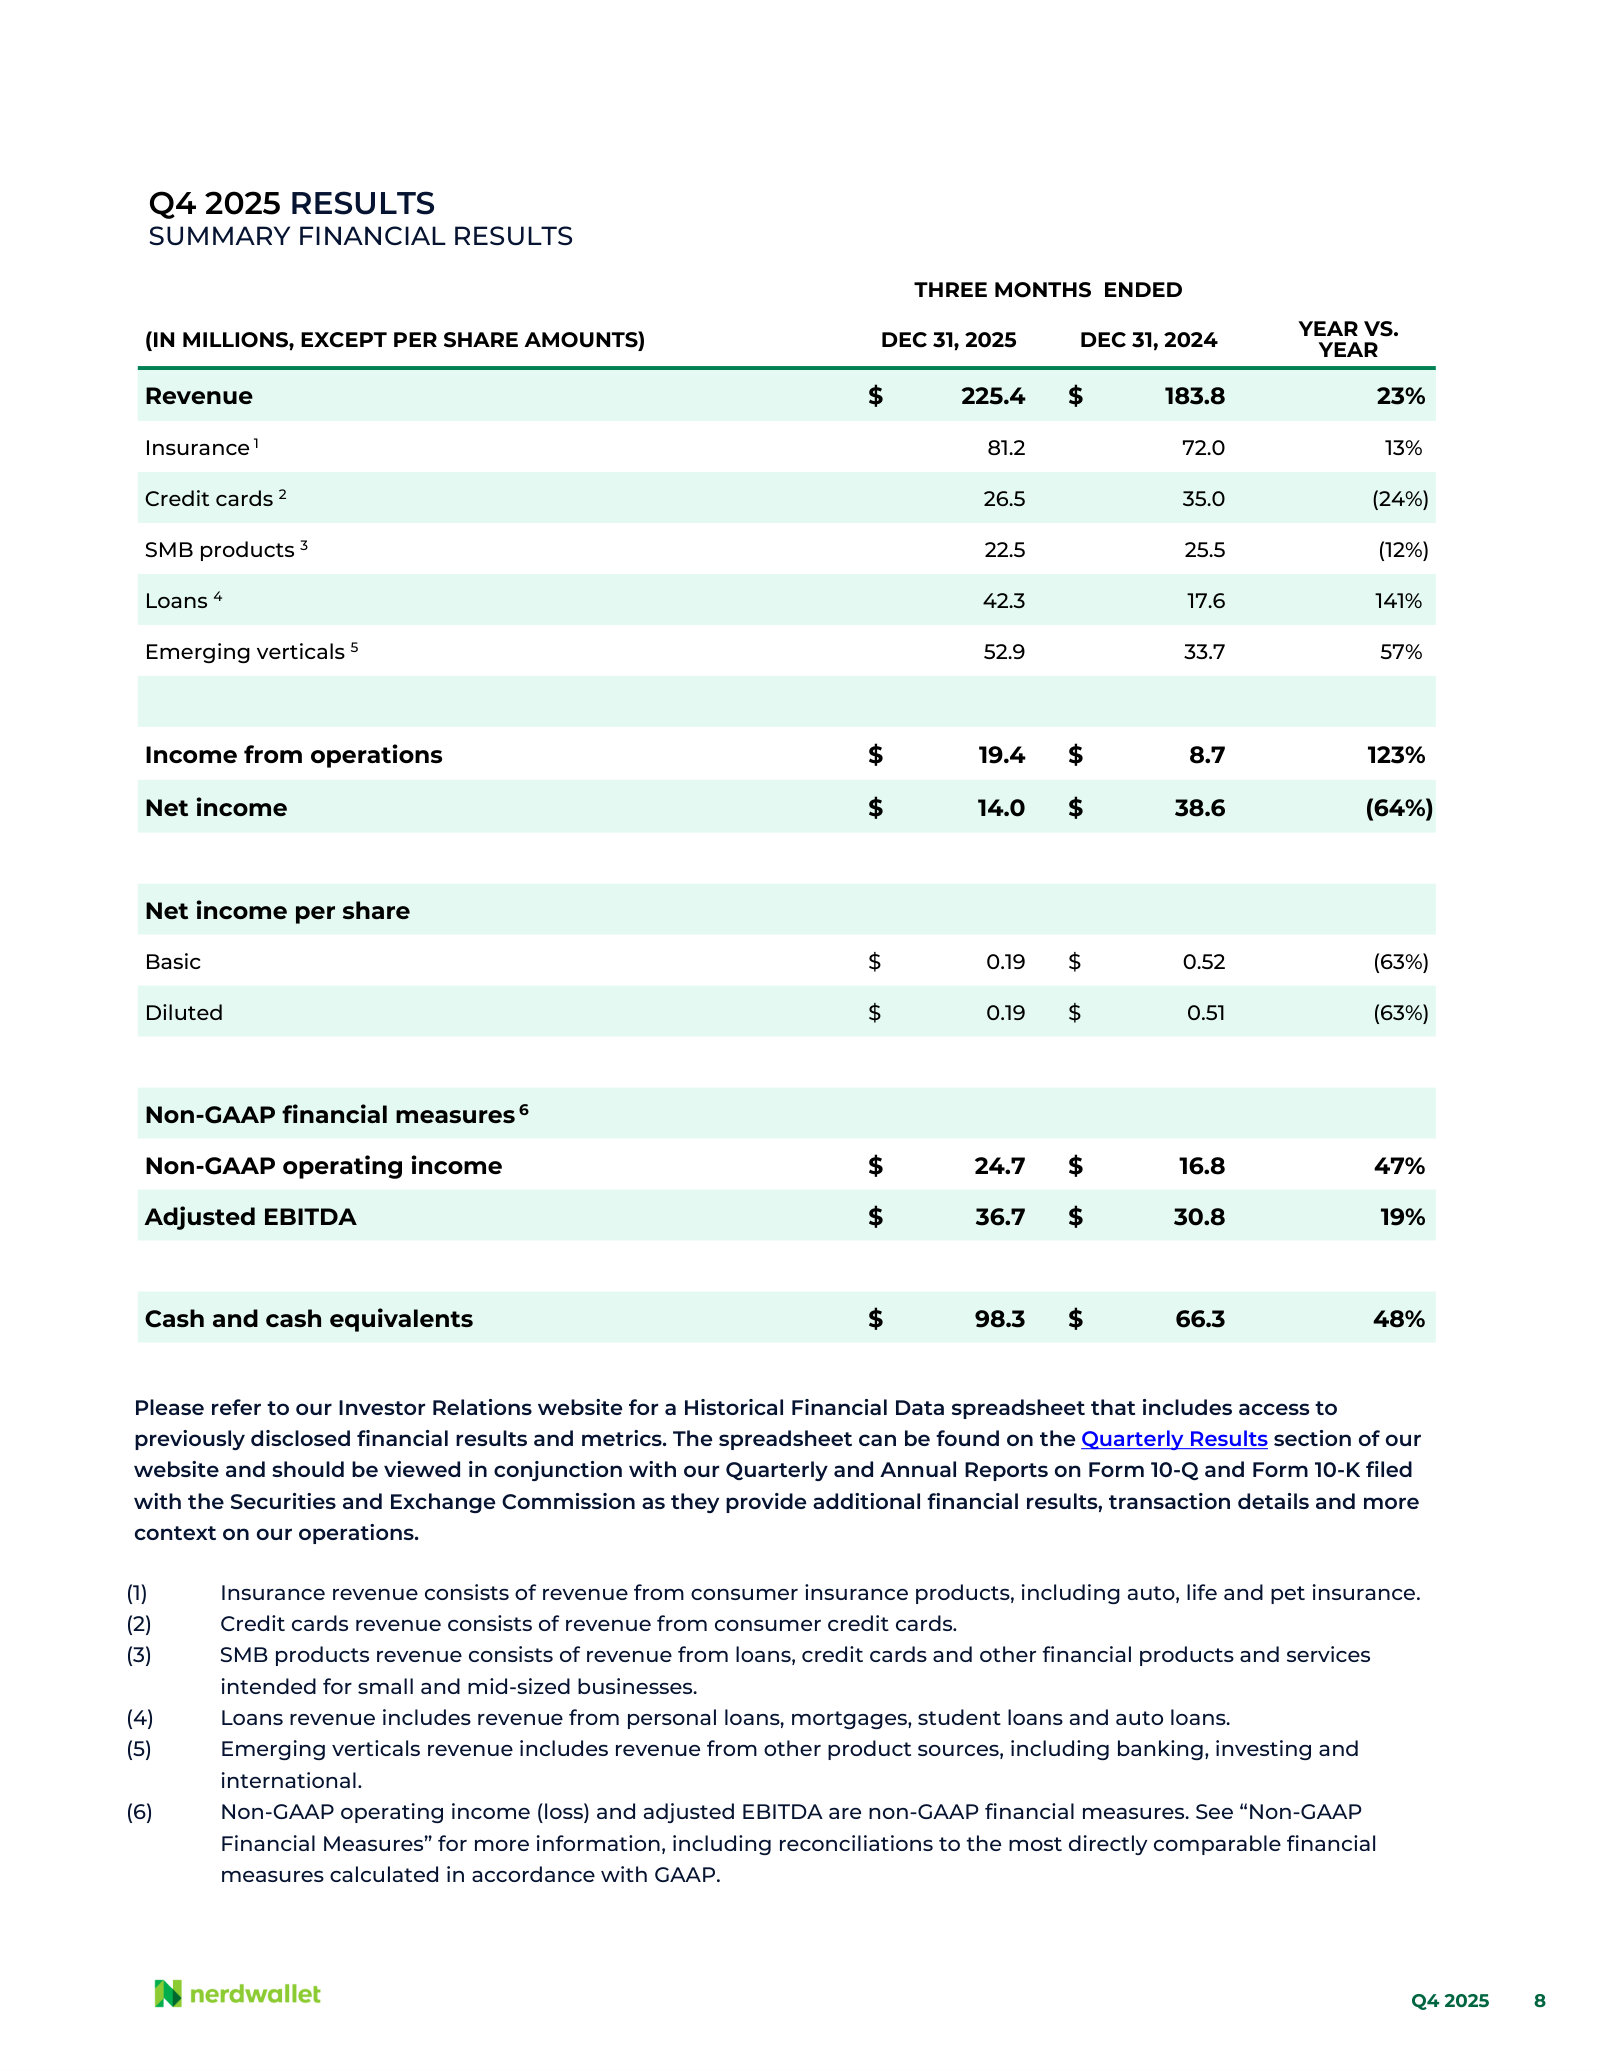
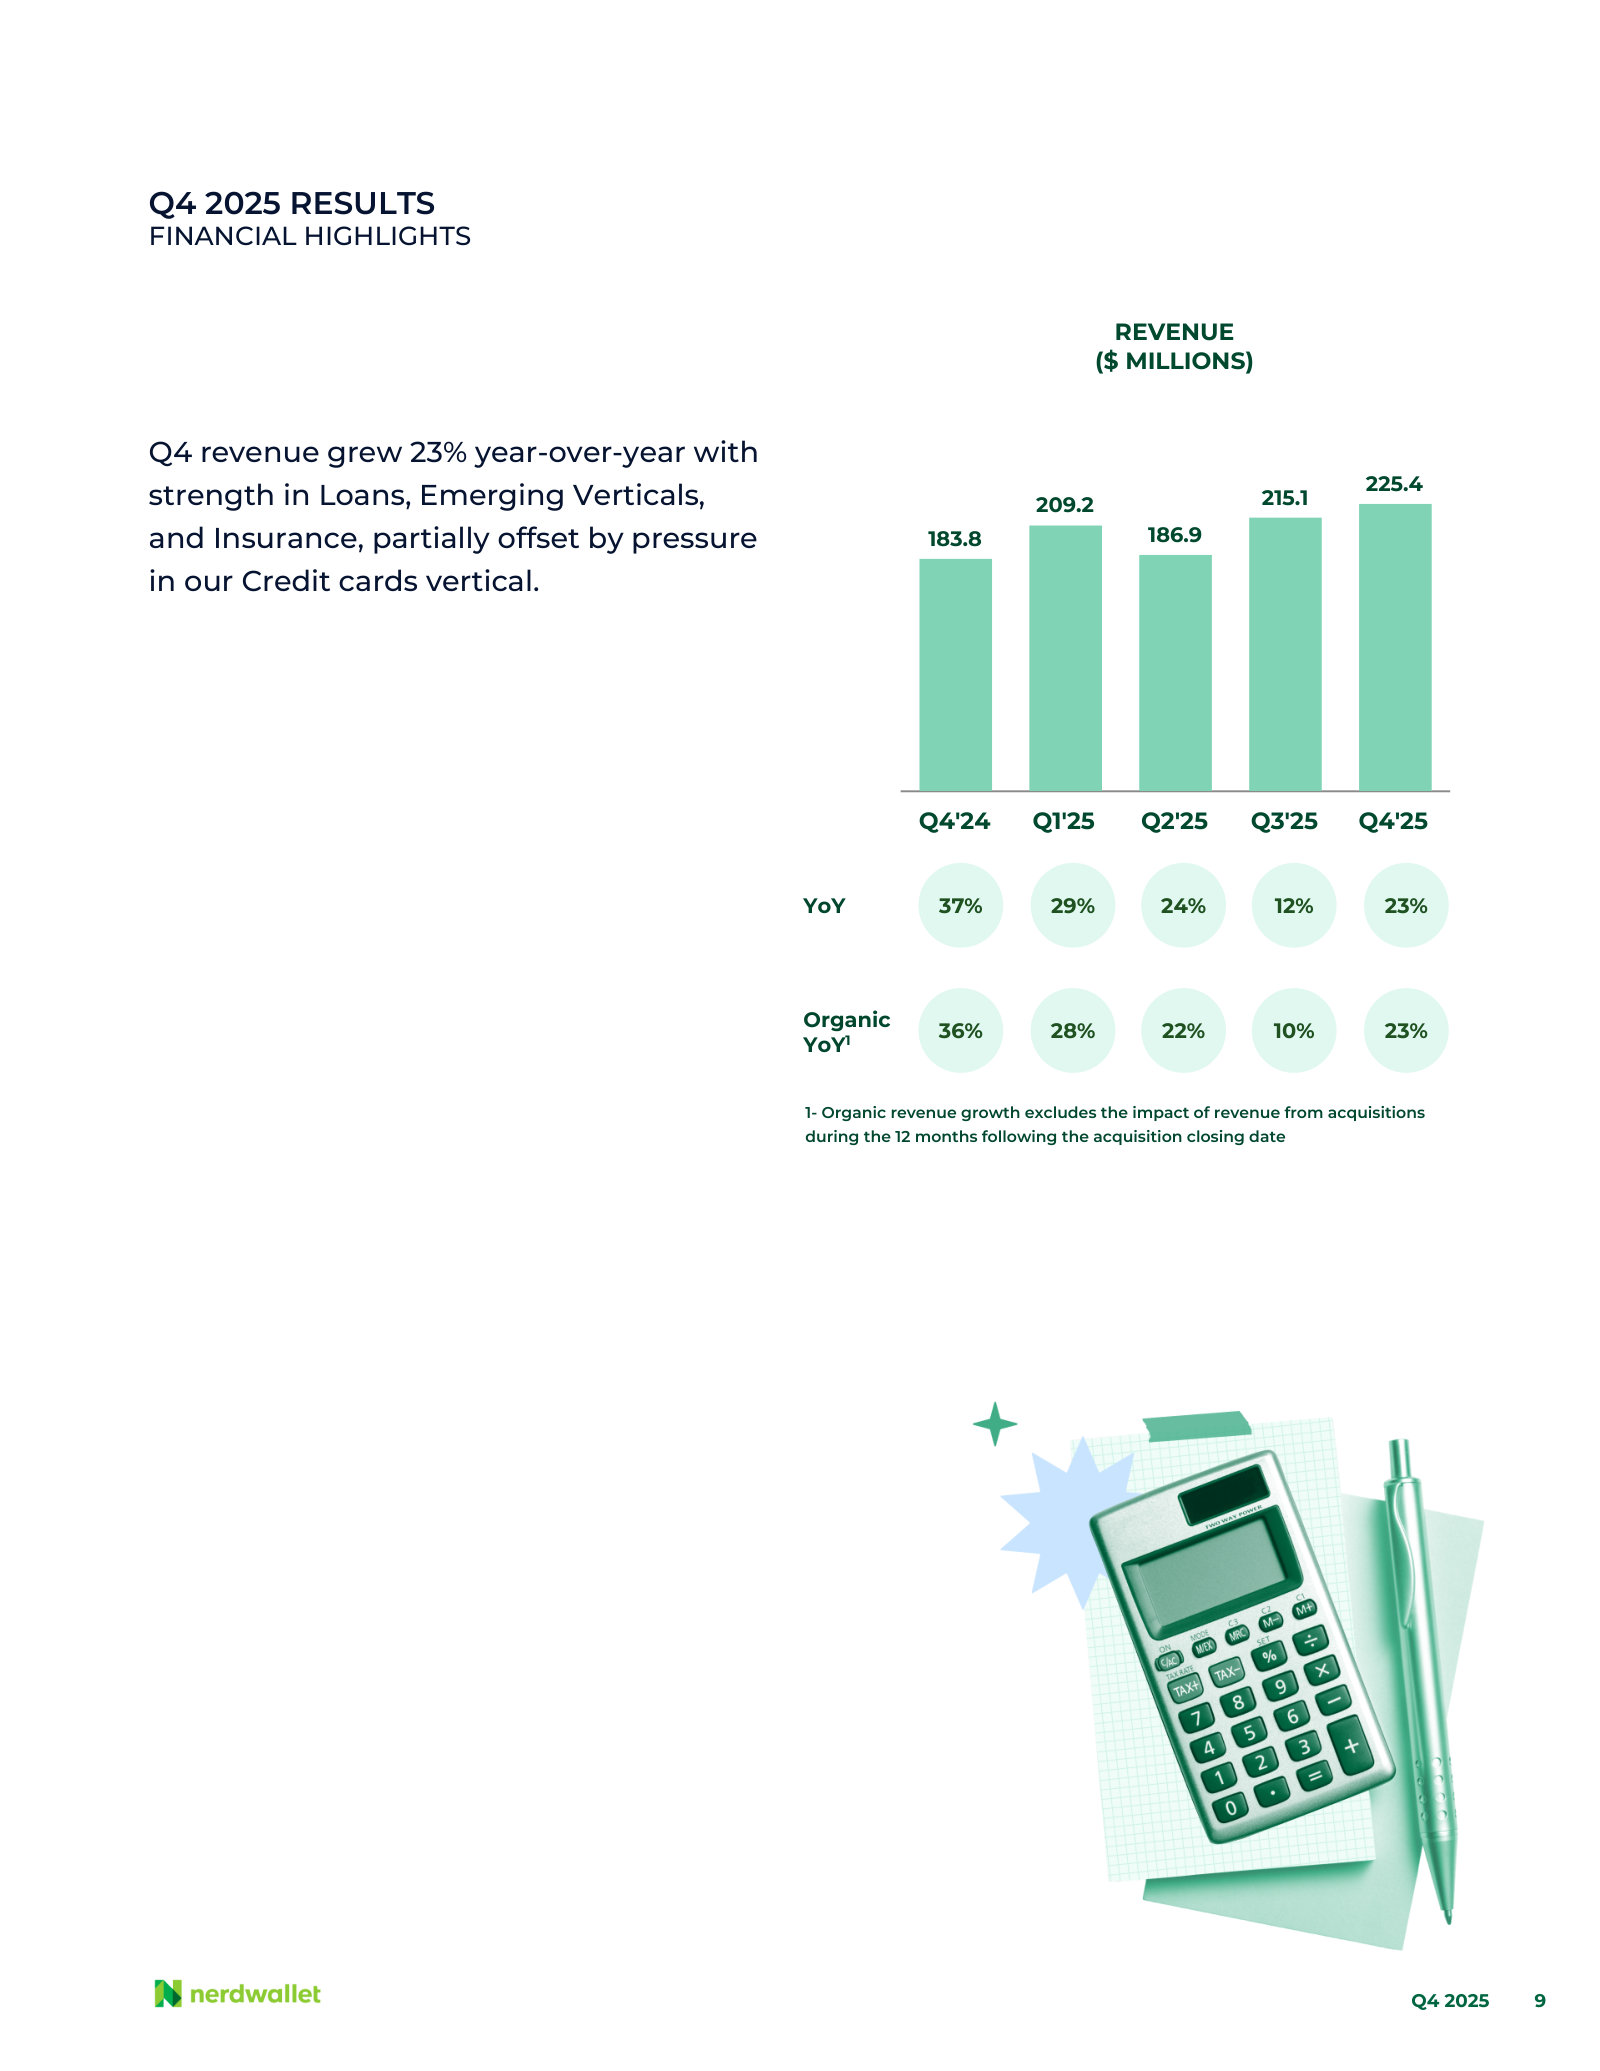
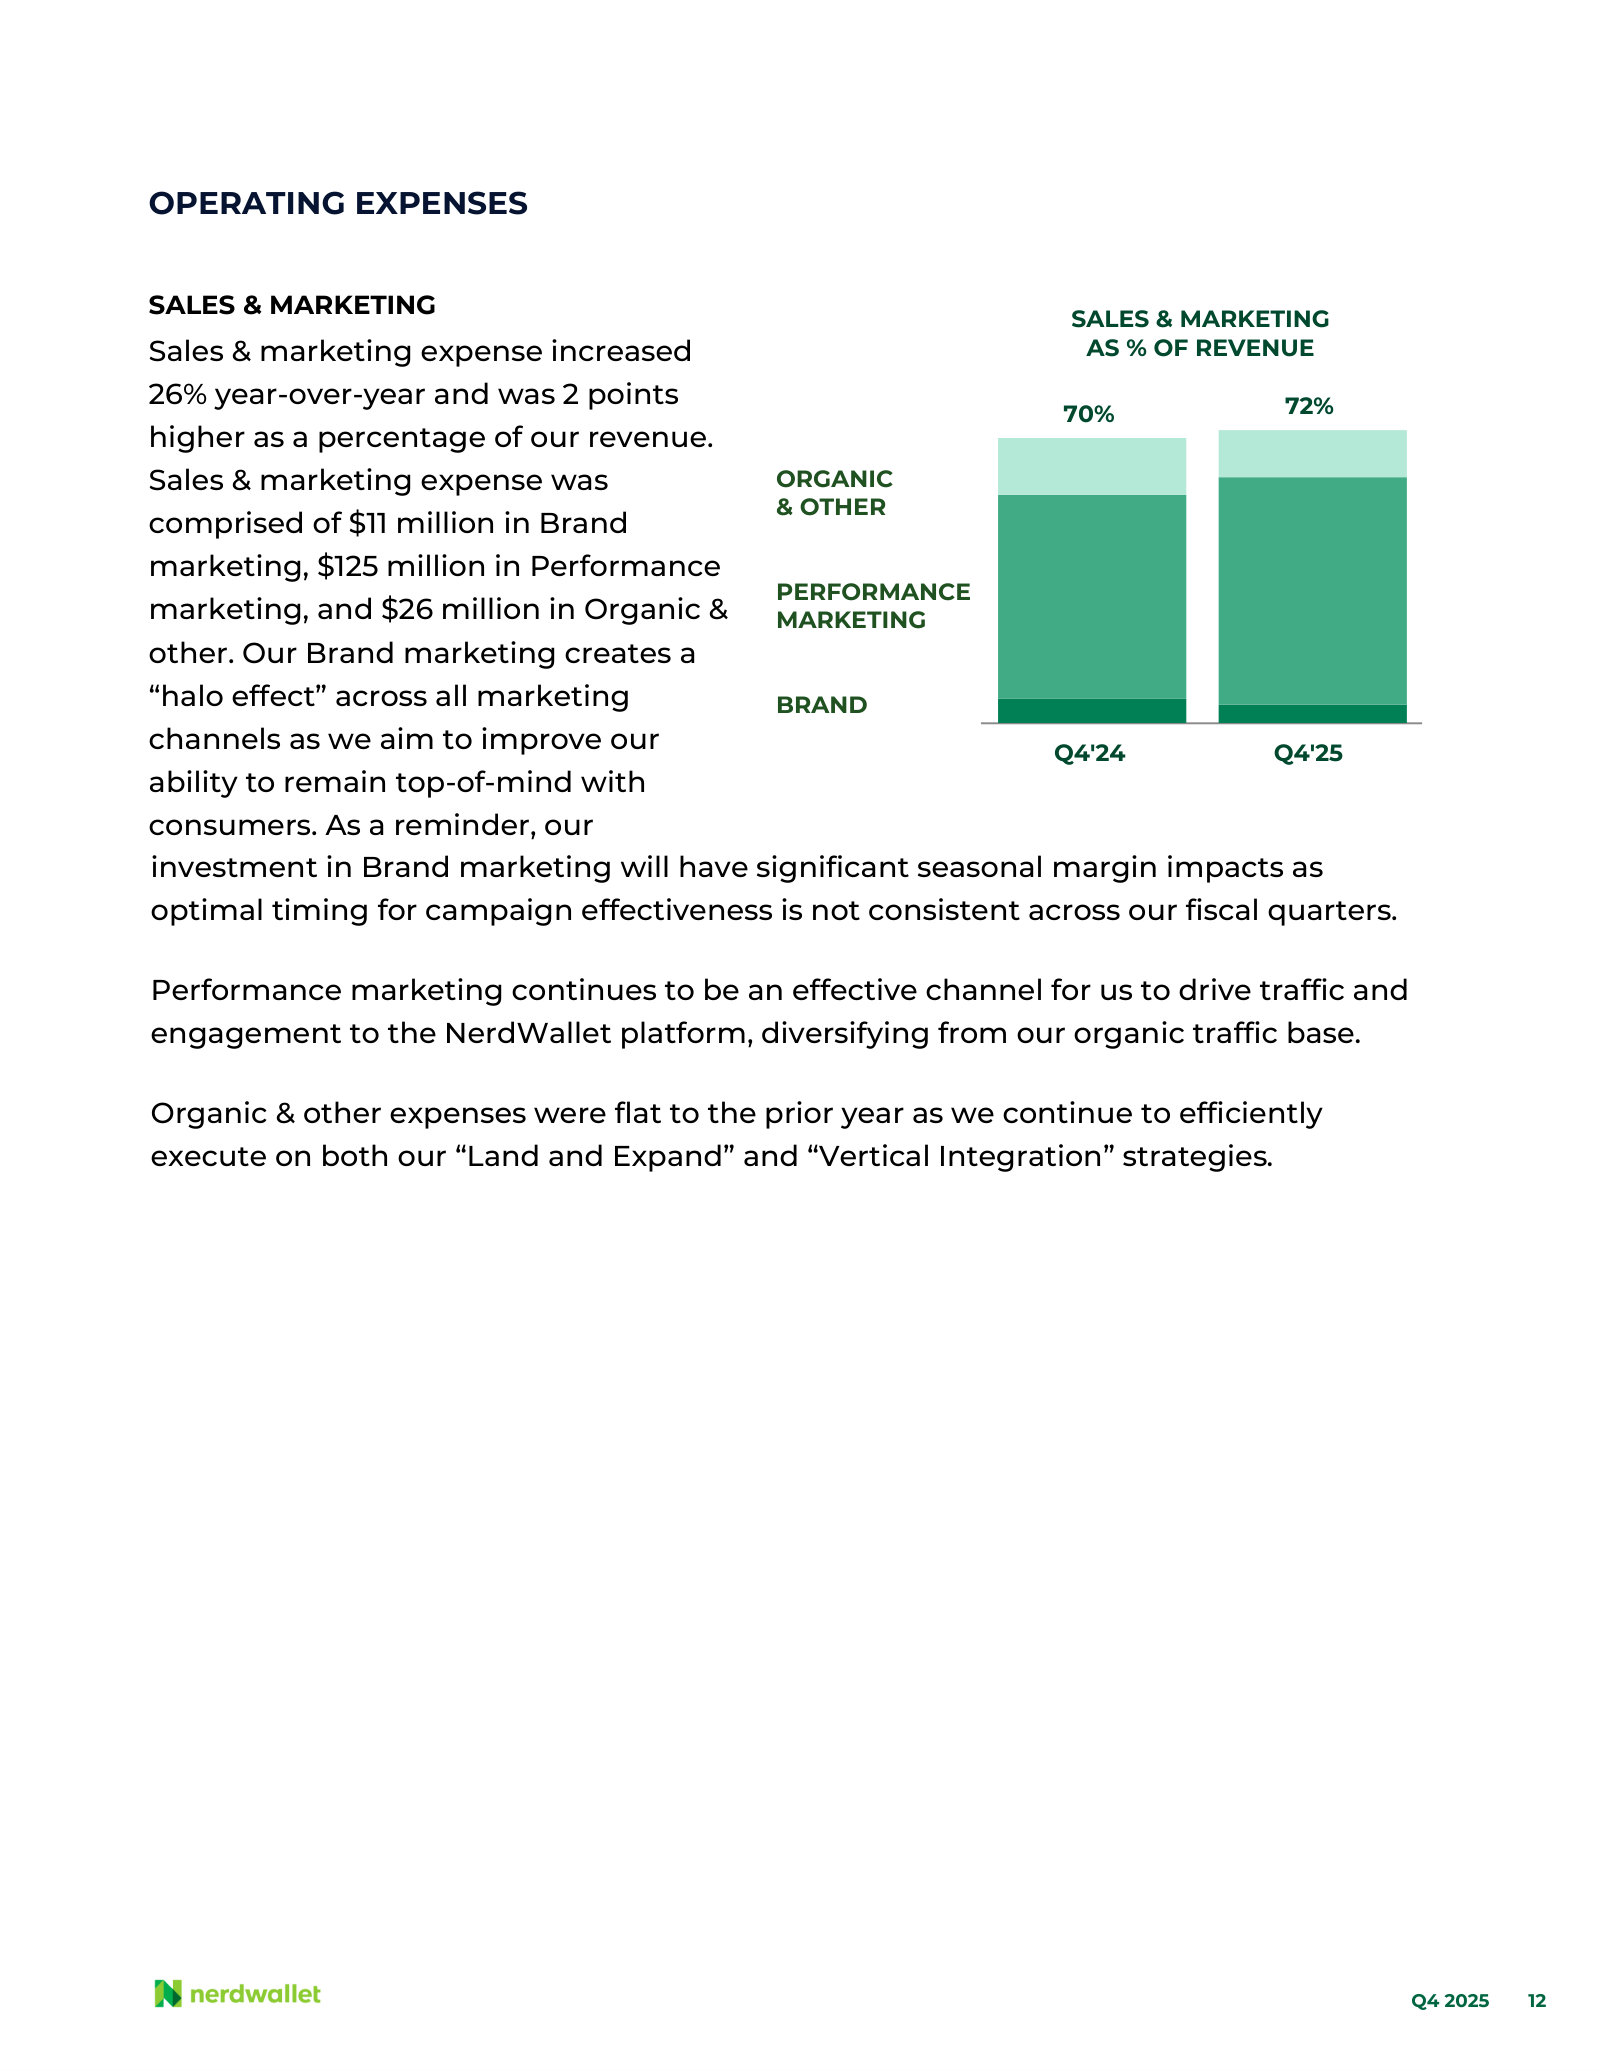
p. 2 — Growth-pillar progress for 2025: below-prime expansion, AI in the SMB concierge, an enhanced data initiative behind CRM outreach. · Open the full presentation →p. 3 — Q4 2025 in eight numbers: $225M revenue up 23%, 11% non-GAAP operating margin, $118M trailing twelve-month free cash flow. · Open the full presentation →p. 4 — The central 2025 problem stated plainly: AI overviews and LLMs cut organic search traffic; paid and direct channels more than offset it. · Open the full presentation →p. 5 — Full-year 2025: revenue $837M up 22%, non-GAAP operating income $96M, roughly double 2024. · Open the full presentation →p. 8 — Q4 revenue across all five verticals — insurance, credit cards, SMB, loans, emerging — before the 2026 reporting change. · Open the full presentation →p. 9 — Five quarters of revenue with reported and organic growth, showing the deceleration through 2025. · Open the full presentation →p. 10 — Vertical by vertical: loans up 141%, emerging verticals up 57%, credit cards down 24% under search headwinds. · Open the full presentation →p. 12 — Sales & marketing split into brand, performance and organic, and why brand spend moves margin from quarter to quarter. · Open the full presentation →
Q3 2025 Shareholder Letter — Q3 2025 · 23 pages · Growth slowed to 12% while margin reached 19%; management's fullest account of the below-prime push and the shift to paid traffic. · Open →
Q4 and Full-Year 2024 Shareholder Letter — Q4 / FY 2024 · 28 pages · Full-year 2024, the insurance surge, and the argument for dropping monthly unique users as a headline metric. · Open →
Q3 2024 Shareholder Letter — Q3 2024 · 26 pages · Where the Next Door Lending mortgage acquisition is explained, and the vertical-integration logic behind it. · Open →
Q4 and Full-Year 2023 Shareholder Letter — Q4 / FY 2023 · 26 pages · Full-year 2023 results and the 2024 guidance that the March 2024 investor deck is built on. · Open →